Friday, March 25, 2011

S&P Recap and A Look Inside the Markets

Good morning, S&P futures are up 3.5 points, the big news this morning is that Japan's nuclear regulator said one reactor core at the quake-damaged Fukushima Dai-Ichi power plant may be cracked and leaking radiation.


I was stopped out of my BGZ (Large cap 3x short) with a 3.93% loss.


Looking at what happened yesterday the headlines  weren't all that good and the market took off. First Moody's downgraded 30 Spanish banks, Portuguese 2-year bonds yields soared to their highest level since 1999 in response to the austerity measures failing and the PM resigning, there was again steam coming out of a couple of reactor buildings at Dai-ichi, and the mess in the Middle East continued. But Initial Claims for Unemployment Insurance for the week ending 3/19 fell by 5,000 to 382,000. This was a bit above the consensus estimate for 380,000 but below last week’s total of 387,000. Continuing Claims for the week ending 3/12 came in at 3.723M vs. 3.700M and last week’s 3.706M. And the Commerce Department reported that Durable Goods orders declined by -0.9% during the month, which was well below the consensus expectations for an increase of +1.1%. When you strip out volatile orders for transportation, orders fell by -0.6%, which was markedly below the consensus for +1.7%. The January reading was -3.0%. Despite the news the futures were pointing to a  modestly strong open.


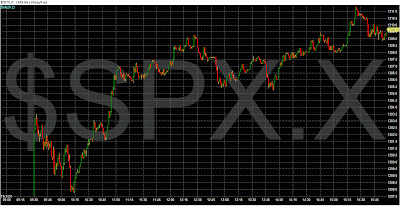
The session began with a small gap higher and continued higher for a few minutes before starting to work lower. By 10:15 am the low of the day was on the chart and buyers came in to buy the dip. The index moved sharply higher for forty-five minutes adding nine points. By 11:00 am most of the move higher was in as well as much of the volume for the day. The index moved sideways with choppy trading and a slight upward bias for the rest of the session to close near the highs.


We finally see strong advancing volume and the ten day average of New Advancing is moving towards bullish territory.


Today's volume was once again light today but the most noticeable spike in volume came just before 11:00 am as the index was ramping higher


or the SPX Index there were 409 components advancing and 73 components declining. On the NYSE 3,135 issues were traded with 2,004 advancing issues and 1,020 retreating issues, a ratio of 1.96 to one advancing. There were 135 new highs and 14 new lows. The five day moving average of New Highs is 101 while the five day moving average of New Lows is 14 and the ten day moving average of Net Advancing is 193.

Advancing volume was higher at a ratio of 3.57 to one. The closing TRIN was 0.56 and the final tick was -111. The five day average of TRIN is 1.38 and the ten day average of TRIN is 1.36. The NYSE Composite Index gained 0.76% today while the SPX gained 0.93%.

For the NYSE, relative to the previous 30 session average, volume was -18.94% below the average. Of the last 15 sessions 4 sessions ended with volume greater than the previous rolling 30 day average volume. Of the last 30 sessions, 20 sessions ended on a positive tick, 6 of last 10. For the SPX, the day's volume was 92.8% of the average daily volume for the last year. Volume was 87.6% of the last 10 day average and 101.3% of the previous day’s volume.


Clearly Tech was the big story today, the Nasdaq 100 has been the leader in this rally that began late last summer and had been lagging recently underperformed the Dow and S&P but today it doubled the output of both those indexes. Once again, I'm at a loss in terms of TA and its rules, oh well new paradigm, new rules I guess. Whats the book for trading QE. It could be titled every dip is a tasty buying opportunity. 


We gapped up four times, never retraced or filled a gap, didn't retest the recent low and now back above 50 and rising. Don't get me wrong, I'm not whining (only lost 4% on that trade), I'm a little confused. 


Sectors stronger than the SPX for Thursday:
- Industrials -- Outperformed the SPX by +10%.
- Technology -- Outperformed the SPX by +62%.
- Health Care -- Outperformed the SPX by +12%.
- Consumer Discretionary -- Outperformed the SPX by +52%.

Sectors weaker than the SPX for Thursday:
- Basic Materials -- Underperformed the SPX by -50%.
- Energy -- Underperformed the SPX by -59%.
- Financials -- Underperformed the SPX by -33%.
- Consumer Staples -- Underperformed the SPX by -2%.
- Utilities -- Underperformed the SPX by -52%.
Thursday, March 24, 2011

Gold and Silver Update

Gold closed at comex closing time at $1437.90 up a cool $10.40. Silver rose to $37.20 up a huge 93 cents.

Gold and silver were hit on the comex opening. However they both rebounded and as of now, gold is trading at its all time high and silver is also at a 31 yr high. Very soon, silver will reach its all time high.


Now lets get Harvey's take on the comex action:


The total gold comex OI, on both official sites, rose by 3198 contracts to rest tonight at 509,131 contracts from yesterday's level of 505,933. Gold had a pretty good day yesterday. Thus we had super demand coupled with the bankers obliging by supplying the needed paper. The front options expiry month of March saw its OI mysteriously rise from 42 to 82 as it seems that someone was in great need of physical gold. We had zero deliveries yesterday so the entire rise in OI increased the gold oz standing. All eyes will now begin to be focused on the next delivery month in gold and that is April. The April OI contracted by 12,432 contracts to 208,067 as we are within a week of first day notice. The OI in April yesterday registered 220,499. The contraction in OI is quite normal.The OI standing in April is a touch to the high side with a week to go. The estimated volume at the comex today was rather low at 152,370 with some switches (roll-overs to June) and the huge run-up in gold price. The confirmed volume yesterday with smaller switches came in at 158,919. I think our bankers are starting to worry about gold as well as silver!!


As for silver:
I first want to report that we have a very very slight contango in silver for the first year out and then we go into severe backwardation. Silver lease rates have fallen off quite a bit but investment yields are still next to nothing as well. If lease rates exceed investment yield then we should have backwardation.


The total silver comex OI rose by 2239 contracts to rest tonight at 135,988 from yesterday's level of 133,949. The bankers throw a temper tantrum whenever total OI exceeds 135,000 in silver. The front delivery month of March saw its OI fall from 875 to 843 for a loss of 32 contracts with zero deliveries yesterday. We therefore got some cash settlements today as Blythe opened up her pocket book. The next front delivery month of May saw the OI rise from 75,855 to 77,100. Probably after receiving the cash settlement plus a bonus, investors bought the May contracts hoping to try their skill again. The estimated volume today was on the slowish side at 57,189. The confirmed volume yesterday was better at 64,170.


Silver target is for 40 bucks by end of march, and then re-buy at 35
Gold target 1540 over the next two months

Watchlist

Here is a list of promising stocks if we regain the 50dma. I have no positions in them as yet but will update when I see good entry.


AA, ATI, APC, ADSK, AZO, BA, CAT, CTAS, COP, DVA, DVN, DV, DFS, ETFC, ECL, FLS, FCX, HAL, HRS, IFF, IRM, LUK, LO, LSI, MEE, MCHP, NBR, NBL, ORLY, PH, BTU, PX, RAI, ROK, SLE, SWN, SVU, TXT, AEM, DYN, WFMI

USO target reached

Taking half off the table in case there is a breakout and I will fade that as most breakouts fail and come back to the point of breakout and then you can re-buy!

S&P 500 Recap and A Look Inside the Markets

Good morning. Global stocks a bit higher today and are now higher than when Japan's earthquake and tsunami struck, buoyed by confidence that the world economic recovery remains on track. The euro has also recovered early losses to trade a touch higher despite negative signs from banking and politics in Portugal and Spain, the two countries now at the center of Europe's continuing debt crisis.Crude is over 106, Silver is at a 30+ year high at 37.8 and Gold is at 1440. The S&P futures are up over 6 points so far.

Yesterday morning there were reports of a spike in radioactive iodine levels found in Tokyo's tap water, another jump in crude, and talk of Portugal needing a bailout if the government doesn't approve austerity measures today put the market in a somewhat defensive position. There was no economic data to review before the open but New Housing Sales at 10 am clearly were disappointing.

The session began with a small gap lower but continued to sell for most of the first forty-five minutes. The S&P attempted a bounce then quickly retested the session lows before sharply rebounding. The ascent lasted the rest of the session with a few periods of consolidation along the way. The S&P closed three points off the highs in the top 20% of the intraday range.


So what now, I still think despite the strong move up to 1300 it was a negative we couldn't breakthrough it. All my BGZ profits went out the window but i still am in it. If the futures stay the way they are or highest we will push right through resistance and lets see if I get stopped out today. 

Something to take note of in the last few sessions is that the volume in declining issues is greater than in advancing issues. there were 271 components advancing and 200 components declining. On the NYSE 3,128 issues were traded with 1,644 advancing issues and 1,368 retreating issues, a ratio of 1.2 to one advancing. There were 91 new highs and 18 new lows. The five day moving average of New Highs is 80 while the five day moving average of New Lows is 17 and the ten day moving average of Net Advancing is -112. The Tick data is bullish and is suggesting institutional accumulation. 

***On the bearish side the 20dma has crossed below the 50dma. I am aware that the time frame is very short and most technicians warn that there is no benefit in the 20/50 day cross and while I agree statistically I feel that we have not had this cross in months, and it may or may not be significant. The more important thing is that the Primary trend (up) which is set by the 200dma or as I like to use the 150 (based on Stan Weinstein) is in tact. The short-term set by price above or below 50dma is (bearish). So that is my primary focus.

Now lets look at the sector performance:

Sectors stronger than the SPX for Wednesday:
- Basic Materials -- Outperformed the SPX by +116%.
- Industrials -- Outperformed the SPX by +6%.
- Technology -- Outperformed the SPX by +27%.
- Consumer Discretionary -- Outperformed the SPX by +59%.

Sectors weaker than the SPX for Wednesday:
- Energy -- Underperformed the SPX by -3%.
- Financials -- Underperformed the SPX by -53%.
- Consumer Staples -- Underperformed the SPX by -8%.
- Utilities -- Underperformed the SPX by -34%.
- Health Care -- Underperformed the SPX by -44%.


Wednesday, March 23, 2011

UUP


Euro, didn't they just bailout Greece, Spain, 
Portugal, are they not in trouble
Swiss Franc, looking good
YEN, didn't they have a massive earthquake and nuclear meltdown possible
How do you think we are doing AMERICA!!!! We are worse off now than at the time of financial crisis.

Closing GLD GDX GDXJ, SIL and SLV

SLV 18.2% gain, GLD 0.79%, Both GDX and GDXJ down 4.5%, SIL down 1%. The reason I am closing these positions is that from what I have been researching GLD and SLV lead me to believe the are practicing fraudulently and at some point there will be an SEC investigation into their vaults to see if they are holding silver or gold respectively and if the amount matches the current price of the trust and at that time we might get a nasty surprise like say Enron or World Con, so I don't want to be stuck holding the bag.

As for the miners I am reading that their costs are sky high and even though the price of the metals is appreciating their profits are not, read the latest quarterly report from NEM. So I'm out of the miners.

Going to focus on TBT, Oil(USO XLE), Uranium miners, Japan, Ag, AGQ(correspond to twice (200%) the daily performance of silver bullion as measured by the U.S. Dollar fixing price for delivery in London. The fund invests in any one of or combinations of the financial instruments (swap agreement, futures contracts, forward contracts, option contracts) as well as unique oppurtunities as they arise.

S&P 500 Recap and A Look Inside the Markets

 Good Morning. Futures are up 4 points. In the news  Reuters reported last night that the radiation from the yet to be controlled leaks from Japan’s nuclear reactors is entering the food supply. Number 1 reactor temperature was 394 degrees on 3:30 according to media outlets.  Most recent news reports indicate that the reactor temperature has reached over 400 degrees Celsius and that worker’s are unable to slow the heating.  At 600 degrees metal softens and it won’t be long after .that until there is a full out meltdown. The Egyptian exchange plunged after reopening after two months as expected. Yesterday morning Japan's Nikkei had surged +4.4% overnight. However, news of another earthquake, slow going at the Daiichi site, and concerns of a prolonged fight in Libya appeared to be keeping stock futures in check. We did not have any economic data to review before the open.

The session began without a significant gap. The high of the day was quickly put on the chart just seven minutes into trading but this was a low-volume narrow-range affair that crept lower throughout the day in a five wave pattern. The SPX closed near the lows.

Still time to short, if it breaks 2 percent over 1300, cover, very good risk reward.
For the SPX Index there were 144 components advancing and 337 components declining. On the NYSE 3,126 issues were traded with 1,290 advancing issues and 1,738 retreating issues, a ratio of 1.35 to one declining. There were 104 new highs and 9 new lows. The five day moving average of New Highs is 68 while the five day moving average of New Lows is 21 and the ten day moving average of Net Advancing is -156.

Declining volume was higher at a ratio of 2.08 to one. The closing TRIN was 1.67 and the final tick was -135. The five day average of TRIN is 1.77 and the ten day average of TRIN is 1.46. The NYSE Composite Index lost -0.34% today while the SPX lost -0.36%.

For the NYSE, relative to the previous 30 session average, volume was -23.46% below the average. Of the last 15 sessions 5 sessions ended with volume greater than the previous rolling 30 day average volume. Of the last 30 sessions, 21 sessions ended on a positive tick, 6 of last 10. For the SPX, the day's volume was 81.16% of the average daily volume for the last year. Volume was 75.4% of the last 10 day average and 73.4% of the previous day’s volume.

Declining volume was greater than declining issues and the ten day average of Net Advancing has quickly dipped back into negative territory. TRIN continues to call for a market bounce, so we have some conflicting signals.
Total tick for the day was 12,000 and the average tick for the day was 8. There were 24 ticks greater than 600 and 22 ticks more extreme than -600. There were no ticks greater than 1000 and no ticks more extreme than -1000.

Today's volume was extremely light and left us with nothing meaningful for the intraday volume pattern. Looking at the Breadth Indicators we are finding things a bit more mixed tonight than last night, suggesting that we see another day or two of choppy narrow range trade as the market decides which way it will go. But as you know I think the next move is down. It's all about QE3 now and I'm not hearing anything yet. The 20dma is hanging on above the 50dma. One other thing you might want to note is that all the gains we are seeing in the S&P happen overnight and the intraday trade has been a loser despite all the gains in the S&P recently, yesterday was another example of this. Don't really know what to make of it. Its seems like the guys in the futures markets are pulling the strings.

Sector Performance:
- Basic Materials -- Outperformed the SPX by +13%.
- Energy -- Outperformed the SPX by +12%.
- Technology -- Outperformed the SPX by +20%.
- Consumer Staples -- Outperformed the SPX by +23%.
- Utilities -- Outperformed the SPX by +46%.
- Health Care -- Outperformed the SPX by +43%.

Sectors weaker than the SPX for Tuesday:
- Financials -- Underperformed the SPX by -15%.
- Industrials -- Underperformed the SPX by -44%.
- Consumer Discretionary -- Underperformed the SPX by -42%.


Tuesday, March 22, 2011

Thank Mr. Obama for Nothing

I hope Obama is having a nice time in Rio, sipping champagne, shopping and frolicking with the Mrs. on the beaches. Spending more money we don't have for hotels, security, hoards of staff to kiss his ass, and polish his shoes etc. Its a joke. He just needs his own talk show, like Oprah or Montel, could you not see that. I bet you thats what he ends up doing after he loses the next election. Oh and lets go fight in Libya now, What? What in the world are we doing there, did Gadaffi attack the US? Folks we are broke, worse than broke, not to mention losing more american lives out in some desert. I know Congress is angry right now, but not for all the right reasons!  


How is this the change we can believe in. How is he any different than curious George. I made a big mistake in voting for this guy.  


Housing is a mess, jobs a mess, healthcare a mess, inflation run a mock, most ever food stamp use and rising, a military spread too thin. What has he done thats any different. NOTHING. 


  • 1. Sent troops to Afghanistan but pulled troops out of Iraq (What planet? He has nt pulled out of Iraq!) we are now at 115,000 troops as of 2/11/2010! Zero actual draw down.
  • 2. Made a more transparent form of Government (almost daily daily Facebook Q&A's with his staff) Has had more closed door meetings then any previous administration. Even his open door committee only has closed door meetings!
  • 3. Tried several times to get the Republicans to join him and get bi-partisanship on the destruction of democracy. Republicans did not wish to contribute!
  • 4. Passed a stimulus package that is creating no jobs across the country. This bill has given more to the rich then every previous President combined!
  • 5. Well on his way to passing the HC bill which will ration health care to most Americans and help less then 12 million. The cost will destroy our children's and grand children's future.
  • 6. Managed to have the two worst months for deficit spending ever. (The two Februarys he has been President)


GOLD making inverse HNS


Big move coming, if you dont see the inverse HNS in the chart above you can see it in GLD below, I'm thinking the next move will take us up another 120 dollars and ounce from here (Target 1520-1540by First week of May 2011). I completely missed this in the morning post, Mea Culpa.


Still not too late to short

I don't see support till 1290, so if you have not shorted yet you only missed a couple points, i'm using the BGZ got in at 38.4 with a sell stop at 36.95, target is the 150dma on the SPX

Silver @ 40 by end of March

I'm not supposed to be predicting but "its starting to look a lot like Xmas". Why I say that is the Silver chart is resembling last years when we had an unexpected run up in price. If you read the update below you will find that there is a huge amount of OI in silver, double what it was in December.

So if you look at the move in Silver in December it was more than 5%, so now we have to factor in double the OI, and the massive short by JPM at 36, that kind of pressure should take us to 40.

If you read my earlier posts, that was my target based just on the chart without any fundamental data. 

Dec 2010

March 2011


Jim Rogers on Collapse of USD

Rogers, who is currently long the yen, notes that the dollar has been declining despite events that would normally trigger a global flight to safety.

He says that if the dollar holds here it could rally as much as 20%, but "if it goes down 3% or 4% from here, I would have to sell and get out and hope I'm still solvent."

Rogers sees a decline in the dollar to historic "multi-multi decade new lows" as a long-term inevitability, but says the time frame for a collapse in the greenback may be sooner than previously thought.

"Somewhere along the line we're going to have a tipping point for the dollar, then it's all over," he offered. "I thought it would happen in a few years; maybe it's going to happen in a few weeks."


Article&Video

Gold and Silver Update

Gold closed today at $1426.10 up $10.20 Silver rose by 94 cents to $36.00. It seems that the price of gold seems to levitate around the $1430 level and silver around $36.00. The banking cartel seems to have drawn a line in the sand forbidding the price to penetrate those levels. Let us head over to the comex and see how things fared over there. 


The total gold comex OI on both official sites rose by 3,011 contracts for a reading tonight of 500,554 from Friday's level of 497,543. This is of course, basis Friday which saw gold and silver rise. Thus a rise in OI is normal and to be expected. 

The front options delivery month of March saw its OI fall from 37 to 16 for a drop of 21 contracts. We had 22 deliveries which accounts for the drop. All eyes are now on the front month of April and here we witnessed that the OI actually rose again from 224,972 to 225,003 with a little over a week to go for first day notice. 

The banking cartel are starting to take notice of the rather large OI standing in gold. The estimated volume today was a rather anemic 114,964. The confirmed volume on Friday was much better registering in at 153,617. 
The total silver comex OI saw its OI rise 468 contracts to 133,076 from Friday's level of 132,608. Silver had a banner day on Friday so the rather low rise in OI probably scared some bankers to cover a few of their shorts. Everybody has their eyes glued to the next piece of data, the front OI month of March. The comex folk notified us that the front delivery month of March saw its OI rise 5 contracts from 893 to 898. We had zero deliveries on Friday so we had a few more standing in line for silver metal. The estimated volume today was a rather slowish 46,875. The confirmed volume on Friday was large at 65,575.
The low volumes on both gold and silver will probably bother our CFTC commissioners as it seems business is flowing to other jurisdictions. (G&S Update by, Harvey Organ)


Fed's Court-Ordered Transparency Shows Americans `Have a Right to Know'

It happened! Wow, can't believe. Love the quote from Sen. Sanders.


A Supreme Court order that forces unprecedented disclosures from the Federal Reserve ended a two- year legal battle that helped shape the public’s perceptions of the U.S. central bank.

The high court yesterday let stand a lower-court ruling compelling the Fed to reveal the names of banks that borrowed money at the so-called discount window during the credit crisis. The records were requested by Bloomberg LP, the parent company of Bloomberg News. In July, Congress passed theDodd-Frank law, which mandated the release of other Fed bailout details.

Fed Chairman Ben S. Bernanke “now must finally understand that this money doesn’t belong to the Federal Reserve, it belongs to the American people and the American people have a right to know how their taxpayer dollars are being put at risk,” said Senator Bernard Sanders, a Vermont Independent who wrote Fed transparency provisions in Dodd-Frank.


Really Tim?!!?? Raise Debt Ceiling, Really?!!??

Treasury Secretary Timothy Geithner said on Wednesday that there was no alternative except for Congress to raise the debt ceiling so that the government can keep borrowing.

S&P 500 Recap and A Look Inside the Markets


Good Morning! Looking at some of the news this morning I found an article where Timmy G is asking the congress to raise the debt ceiling so the govt can keep borrowing and spending, that just makes me itch! It was a small article that just kind went unnoticed once again WTF people? On my twitter feed I follow professional traders and money manager, most of these guys are on TV from time to time and some everyday, not so I can piggy back on their trades but just to see what they think and talk about. I usual do say this but none of these guys cares abut the debt. Not a single one. NOT ONE. Maybe they don't care about what is to happen just what is happening, I guess thats what you are supposed to do as a trader, so I'll give them the benefit of the doubt. I seriously doubt so many intelligent people out there have blinders on regarding the state of this nation. Oh UK inflation grew at a faster pace than expected as we as Portugal is in big trouble, possible government collapse is immanent because they are running out of money.

In any case we had a big move up yesterday in the pre-market the major foreign markets were higher and Japanese markets were closed for a holiday but the rest of the world markets were strong as the global markets looked to continue the rebound from last week's lows.

The week began with a huge upward spike at the open then continued higher steadily until a bit after 10:00 am. But that was followed by several hours of trading within a three point range as 1300 provided resistance and the entire session traded within a six point range after the first four minutes.

For the SPX Index there were 439 components advancing and 45 components declining. On the NYSE 3,123 issues were traded with 2,476 advancing issues and 579 retreating issues, a ratio of 4.28 to one advancing. There were 123 new highs and 9 new lows. The five day moving average of New Highs is 53 while the five day moving average of New Lows is 35 and the ten day moving average of Net Advancing is 46.

Advancing volume was higher at a ratio of 4.07 to one. The closing TRIN was 2.49 and the final tick was 644. The five day average of TRIN is 1.7 and the ten day average of TRIN is 1.37. The NYSE Composite Index gained 1.72% today while the SPX gained 1.48%.

For the NYSE, relative to the previous 30 session average, volume was -17.23% below the average. Of the last 15 sessions 6 sessions ended with volume greater than the previous rolling 30 day average volume. Of the last 30 sessions, 22 sessions ended on a positive tick, 7 of last 10. For the SPX, the day's volume was 110.5% of the average daily volume for the last year. Volume was 104.1% of the last 10 day average and 97.8% of the previous day’s volume.

Breadth was good today while the advancing volume was a bit weak. It is a bit odd to see such a closing TRIN after a large gaining session. The ten day average of Net Advancing has sprinted back into positive territory and the NYSE Composite Index outperformed the SPX. All-in-all, the data suggests that this rally could have more room to run.

Total tick for the day was 202,000 and the average tick for the day was 130. There were 99 ticks greater than 600 and 6 ticks more extreme than -600. There were 1 ticks greater than 1000 and no ticks more extreme than -1000. The tick action suggests institutional accumulation.

We saw decreasing relative volume throughout the session. It seemed as though interest was waning in buying as the SPX challenged 1300 but there really was no interesting in selling either. Checking the Breadth Indicators we see a complete reversal from last week. The Bulls seem to have resumed command.


We may get another 2-3 percent rally in the SPX over this week but I think we will be challenging the recent lows and slowly bleeding to reach the 150dma as the next Fed meeting approaches. Another bearish sign is the collapse of the 20dma, it has been very strong the last time it crossed below the 50dma was last fall, so keep an eye on that as well. Staying above the 50dma is very bullish in my view.

Things to watch for that theory to change, QE3 talk starts earlier than I expect, and technically the SPX holds the 50dma once it recaptures it. No cross of 20 below 50dma. 

 Sectors stronger than the SPX for Monday:
- Basic Materials -- Outperformed the SPX by +22%.
- Energy -- Outperformed the SPX by +148%.
- Industrials -- Outperformed the SPX by +64%.
- Technology -- Outperformed the SPX by +25%.
- Consumer Discretionary -- Outperformed the SPX by +3%.

Sectors weaker than the SPX for Monday:
- Financials -- Underperformed the SPX by -100%.
- Consumer Staples -- Underperformed the SPX by -26%.
- Utilities -- Underperformed the SPX by -32%.
- Health Care -- Underperformed the SPX by -67%.


Software Problem Resolved

First of let me say my charts have been off for a week. I didn't realize that my historical index charts data was corrupted so the markers I have been using are all off. I was curios how I was getting 1293 for the 50dma on the S&P when in fact it was 1300. So my trade and my views are somewhat off. Luckily it didn't cost me money but everything I have been writing about the S&P is a little off.

So the S&P spent most of the gap up doing nothing butting its head at the 50dma. My  thoughts were right but the numbers were wrong. Still by some dumb luck I did put on the short at BGZ 38.4 coincidently when the S&P was up 18 or 19 points so I didn't nail it exactly but i got it pretty close to 50dma. 

Monday, March 21, 2011

1300

The bears are putting up a big time fight and the bulls just can't seem to take it out. Multiple moves to push through that mark have failed. Bulls running out of gas, maybe?

China Imports 245 Tonnes of Silver in February

Gold and silver rose on the open in Asia and have continued those gains so far in European trading with the Libyan military conflict leading to a safe haven bid and falls in the dollar and yen. The all time and multiyear nominal dollar highs set on March 7th ($1,444.95/oz and $36.75/oz) look set to be challenged as gold is less than 1% from its record high and silver less than 2% from its nominal recent high.

Full Story

Silver (AGQ) Waiting on Blythe

Silver is over 36 dollars and I am waiting for BM (Blythe Masters not bowel movement), JPM's commodity chief to put a hurt on my silver positions. She is nowhere to be found.


Watch around 1-2pm, (she maybe busy at the moment) for a Silver raid. I have a big gain this morning on the AGQ's thinking I'll take half off the table before she spanks me. Greed is getting the best of me, but safety is off, will pull trigger on the sell if there is any sign of Blythe.

Be very afraid! They have an unlimited amount of money, where do they get it? From a rich uncle, so I hear. Who? Its their uncle Ben something or other, not sure. : - )

Whoops!

Made a mistake on the last post for BGZ, that stop out at 36.95

Time to Short SPX

So far its playing out almost exactly the way I have been writing about it. We are going to be back up to the 50d sma or close to it, the stockcharts.com chart is off and I have 1293 level as my line in the sand so to speak, we will gap up and open at 1290 this morning and probably push up a little higher. I anticipate this rally will be faded. But in case its not, this is a great risk reward point to short, I will risk a 5% loss vs a 20+% gain any day of the year.

Went long BGZ (triple spx short), at 38.4 stop placed at 37.95

Arab League Split Over Action Against Libya

In an attack that carried as much symbolism as military effect, a cruise missile blasted a building near Gadhafi's iconic tent.

It was not known where Gadhafi was at the time, but it seemed to show that while the allies trade nuances over whether his fall is a goal of their campaign - he is not safe.

An Associated Press photographer escorted to the scene by the Libyan government said half of the round, three-story administration building was knocked down.

Smoke rose from the building and pieces of the missile were scattered around the scene.

About 300 Gadhafi supporters were in the compound at the time. It was not known if any were hurt.


Read more

Sunday, March 20, 2011

S&P Index Recap and A Look Inside the Markets

On Friday, quadruple witching began with an many new developments,  the U.N. Security Council finally authorized a no-fly zone and attacks against Libya. The G7 intervened in the foreign exchange market to limit the Yen's rise. China raised bank reserve requirements for the third time this year. And finally TEPCO (Tokyo Electric Power Co.) reported that power will be restored to all four crippled reactors by Sunday. Nike missed earnings and talked about rising costs and their plans for hiking prices (Procter & Gamble was also talking about raising prices). All of this was leading to a continuation of Thursday's rebound in stock prices.

As did Thursday, the Friday session began with a huge upward gap. The high of the day was quickly put on the chart within the first fifteen minutes of trading. The next forty-five minutes gave back seven points but was quickly followed by a six point bounce. But from a little after 11:00 am the rest of the session was a slow decline giving back a net of eight points to close the day more than nine points off the highs.

In the past couple of days we saw the SPY close lower than the open after a large gap higher. These were sessions that closed in positive territory but traded more like down days. While the two sessions netted a gain of eighteen points the sessions didn't close at the highs.


For the week the SPX lost 25.07 points during the week. The range for the week was 52.14 points, 4.01%. The last time the weekly range exceeded 4% was the last week of August. The four week RSI of the four indices (SPX, Dow, NASDAQ, and Russell 2000) is 29. Pullbacks often occur as this RSI reaches 80 and bounces near 20.

Total tick for the week was 159,000. On the NYSE, the advance/decline line decreased during the week by 1,679 and the 10 day average of Net Advancing decreased from -2 to -303. There were 178 New Highs and 195 New Lows. This is the first week that New Lows exceeded New Highs since the first week of July 2010.

The weekly charts have turned downward; this was the fifth week of lower highs. One measure of a rally ending is to watch for a weekly close below the 50 DMA. Friday's close was the first weekly close below the 50 DMA since the end of August. At that time, QE2 was announced and the market rallied sharply. The market then had a new inflow of cash, and no earthquake, tsunami, nuclear crisis or Middle East turmoil to worry about.

The markets need a catalyst, other than the announcement of QE3, I don't see anything. Even if the headlines I listed above were to somehow magically go away, it won't be enough its a liquidity issue. Hedge  funds were already margined to the hilt prior to this pullback. 


or the SPX Index there were 342 components advancing and 138 components declining. On the NYSE 3,124 issues were traded with 2,181 advancing issues and 843 retreating issues, a ratio of 2.59 to one advancing. There were 50 new highs and 20 new lows. The five day moving average of New Highs is 36 while the five day moving average of New Lows is 39 and the ten day moving average of Net Advancing is -303. The Net Advancing data indicates a bearish trend.

Advancing volume was higher at a ratio of 2.4 to one. The closing TRIN was 0.94 and the final tick was 142. The five day average of TRIN is 1.43 and the ten day average of TRIN is 1.25. The NYSE Composite Index gained 0.64% today while the SPX gained 0.43%.

For the NYSE, relative to the previous 30 session average, volume was 76.54% above the average. Of the last 15 sessions 7 sessions ended with volume greater than the previous rolling 30 day average volume. Of the last 30 sessions, 22 sessions ended on a positive tick, 6 of last 10. For the SPX, the day's volume was 113.1% of the average daily volume for the last year. Volume was 107.7% of the last 10 day average and 114.1% of the previous day’s volume.

Advancing volume was a bit weaker than advancing issues but the NYSE Composite Index outperformed the SPX, so we are seeing mixed signals. Still, the trend is down until we have a reversal on the weekly charts.

Total tick for the day was 131,000 and the average tick for the day was 85. There were 56 ticks greater than 600 and 37 ticks more extreme than -600. There were no ticks greater than 1000 and no ticks more extreme than -1000.

The large volume spike at the open is typical of options expiration. There really isn't much else to see in the intraday volume pattern. Looking at the Breadth Indicators we still see a lot of inconsistency. But the McClellan Oscillator is still oversold while the Summation Index is not.


What to look for: I think we can rally back to the 50dma and thats about it, if we get above it it won't be for long. Like I said before we need a catalyst, and we probably won't get one till we are closer to the next Fed meeting.