Thursday, December 30, 2010

Market Recap

Short term target 31.75, if it takes out resistance at 30
What is there to say another torturous slow paced low volume day with some bullish overtones. Unless you own Silver and Gold and some uranium of course. Metals have been on fire since Tuesday!  The DXY has been weak after Xmas and the bonds are taking it on the chin as well.
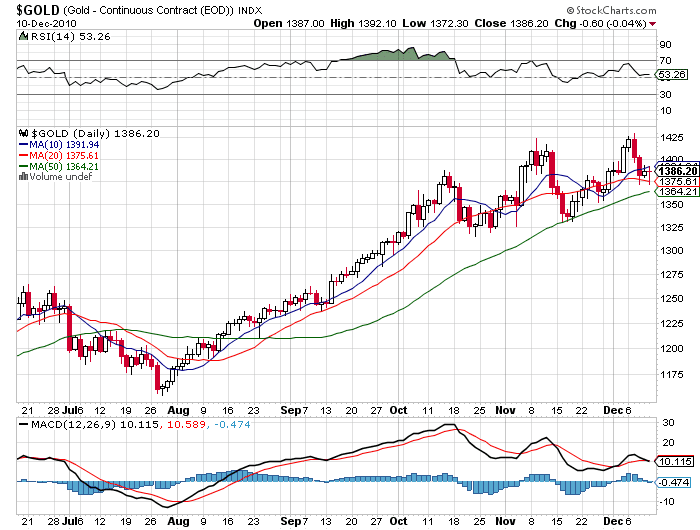
Gold still has serious work to do see major resistance line its
 going to take a big fall in the dollar to get this move higher.


The dollar index is down a percent this week if we see the UUP fall below 22.8 i think gold will breakout at that point and silver will we over 32. Something major has to happen for this to play out but the charts are signaling something to come soon.


The SPX Index there were 262 Advancers/210 Decliners. On the NYSE 3,147 issues were traded with 1,950 advancing issues and 1,121 retreating issues, a ratio of 1.74 to one advancing. There were 189 new highs and 17 new lows. The five day moving average of New Highs is 170 while the five day moving average of New Lows is 14 and the ten day moving average of Net Advancing is 329. The Net Advancing data indicates a bullish trend.


Advancing volume was higher at a ratio of 1.59 to one. The closing TRIN was 1.1 and the final tick was -8. The five day average of TRIN is 1.11 and the ten day average of TRIN is .99. The NYSE Composite Index gained 0.38% today while the SPX gained 0.1%. For the NYSE, relative to the previous 30 session average, volume was -47.27% below the average. Of the last 15 sessions 3 sessions ended with volume greater than the previous rolling 30 day average volume. Of the last 30 sessions, 18 sessions ended on a positive tick, 5 of last 10. For the SPX, the day's volume was 48.5% of the average daily volume for the last year. Volume was 56.4% of the last 10 day average and 92.3% of the previous day’s volume.
 
Breadth today was substantially stronger than a one point index gain suggested. But advancing volume was weaker than advancing issues. So we don’t believe that today’s breadth tells us much. 
Total tick for the day was 205,000 and the average tick for the day was 132. There were 3 ticks greater than 600 and 0 ticks more extreme than -600. There were no ticks greater than 1000 and no ticks more extreme than -1000.
Headed to 22.8

 
There were only three ticks more extreme than 600 all day. But almost 80% of all ticks were positive. Looking at the Nightly Breadth Indicators reveals what we have seen the last several days; sluggish almost nonexistent trade action with the likelihood of a few more days like this.


Short Long Bond, Long Miners Metal and Uranium, Long Precious Metals, Sold AIB for 21% loss, hold IRE 22% gain, Close out CRUS for 5% loss today. Otherwise no change.

Thursday, December 23, 2010

Wednesday Recap: A Look Inside the market

The third quarter GDP showed the economy grew at an annualized rate of 2.6% in the quarter. This was below the consensus expectations for a growth rate of 2.8% but above the first revision of 2.5%. (Recall that the final Q2 rate was +1.7% and Q1 was +3.7%). Looking at the all-important consumer activity, the Personal Consumption component of the report came in slightly below expectations with a gain of 2.4% vs. the consensus for 2.5% and the first revision’s +2.8%. (Last quarter was 2.2%.) Stock futures in the U.S. pointed to a flat open.


The sluggish pre-holiday session opened without a gap and began the habitual relentless grind slowly higher. After several hours of slow creep the high of the day was put on the chart at 12:32 and the afternoon consisted of a three point decline before a mild bounce into the close. But everything was mild on this day as this was a typical pre-holiday session with the smallest trading range in nine months. The banks really rallied on Wed  on solid volume but the overall volume was very low but seasonal.

For the SPX Index there were 273 Advancers/168 Decliners. On the NYSE 3,160 issues were traded with 1,876 advancing issues and 1,182 retreating issues, a ratio of 1.59 to one advancing. There were 215 new highs and 15 new lows. The five day moving average of New Highs is 194 while the five day moving average of New Lows is 24 and the ten day moving average of Net Advancing is 303.


Advancing volume was higher at a ratio of 1.48 to one. The closing TRIN was 1.07 and the final tick was 88. The five day average of TRIN is .76 and the ten day average of TRIN is .82. The NYSE Composite Index gained 0.32% today while the SPX gained 0.34%.

For the NYSE, relative to the previous 30 session average, volume was -25.03% below the average. Of the last 15 sessions 5 sessions ended with volume greater than the previous rolling 30 day average volume. Of the last 30 sessions, 19 sessions ended on a positive tick, 7 of last 10. For the SPX, the day's volume was 28.1% of the average daily volume for the last year. Volume was 82.1% of the last 10 day average and 100.5% of the previous day’s volume.
 
Total tick for the day was 142,000 and the average tick for the day was 92. There were 27 ticks greater than 600 and 0 ticks more extreme than -600. There were no ticks greater than 1000 and no ticks more extreme than -1000.


I don't expect my much for the rest of the year. I suspect the dollar index will rise to 81.50 and then continue back down. The precious metals will suffer at the hands of the dollar strength. No changes in long-term view. 

Tuesday, December 21, 2010

Monday Market Recap: A Look Ahead


Uncle Kim (http://www.youtube.com/watch?v=xh_9QhRzJEs) said he wouldn't retaliate against S. Korea for military drills and that kept the futures up in the early morning session. When the S&P opened there was  there was a two point gap higher, then over the next hour and a half we found the SPX at +4 and then the bears came in pushed the market down 7 points from the high of the day.  But as we have seen it before there was a painfully slow 4 hour climb to close of the session, so one could say if there was anything exciting going on it happened very early. On the day there were 263 Advancers/182 Decliners. On the NYSE  1,516 advancing issues and     1,553 retreating issues, a ratio of 1.02 to one declining. There were 206 new highs and 21 new lows. The five day moving average of New Highs is 202 while the five day moving average of New Lows is 54 and the ten day moving average of Net Advancing is 47. The the outperforming sectors were Materials, precious metals, consumer discretionary and energy but everything else pretty much was flat to down.


The dollar index which was weak most of the day finished in the upper part of the days trading range, albeit down slightly.


Advancing volume was higher at a ratio of 1.72 to one. The closing TRIN was 0.57 and the final tick was -583. The five day average of TRIN is .96 and the ten day average of TRIN is .75. The NYSE Composite Index gained 0.15% today while the SPX gained 0.25%.
 
For the NYSE, relative to the previous 30 session average, volume was -21.75% below the average. Of the last 15 sessions 7 sessions ended with volume greater than the previous rolling 30 day average volume. Of the last 30 sessions, 18 sessions ended on a positive tick, 6 of last 10. For the SPX, the day's volume was 77.5% of the average daily volume for the last year. Volume was 75.3% of the last 10 day average and 73.5% of the previous day’s volume.
 
NYSE breadth was negative today although advancing volume was positive. The ten day average of New Advancing is near zero. The NYSE Composite underperformed the SPX. Market breadth continues to suggest an imminent pullback but Price continues to creep higher. 
Total tick for the day was -43,000 and the average tick for the day was -28. There were 41 ticks greater than 600 and 56 ticks more extreme than -600. There were 1 ticks greater than 1000 and 7 ticks more extreme than -1000. The tick action suggests institutional distribution.
 
The breadth indicators continue to scream, "a top" but also suggest that this could go on a while longer. The McClellan Oscillator has been hanging around zero for quite some time.


Monday, December 20, 2010

Friday Recap, A look ahead

Weekly Chart
On Friday decent economic news, and better than expected earnings from Oracle and RIMM as well as the German IFO Business Climate Index increase for the seventh straight month was offset by the fact that Moody's downgraded Ireland, so stock futures were basically flat as the open leading to the quadruple-witch expiration session. 


For the week the SPX gained 3.5 point. The four week RSI of the four indices (SPX, Dow, NASDAQ, and Russell 200) is 83. Pullbacks often occur as this RSI reaches 80 and bounces near 20.
During the week there were 274 advancing and 175 declining stocks. Total tick for the week was 90,000. The number of components with their 5 DMA above their 20 DMA decreased during the week from 70.6% to 56%.


 On the NYSE, the advance/decline line decreased slightly during the week by -32 and the 10 DMA of Net Advancing dropped from 279 to 50. The Semiconductors (SMH) have been really outperforming this market since August and lately the Financial sector (XLF) has been very strong. Its 150dma has started to climb as well and this sector should lead the next leg up.

The weekly range was a mere 14 points, 1.12%. This is the smallest weekly range in years. This year has seen ten weeks with a range less than 2% whereas 2009 only had two such weeks and both were the holiday weeks at the end of the year. Such tight range weeks often lead to pullbacks but we have seen since the end of August that these tight range weeks are the pullback.


For Friday, in the  SPX there were 262 Advancers/187 Decliners.  On the NYSE 3,145 issues were traded with 1,706 advancing issues and 1,357 declining issues, a ratio of 1.26 to one advancing. There were 176 new highs and 22 new lows.  The five day moving average of New Highs is 207 while the five day moving average of New Lows is 67 and the ten day moving average of Net Advancing is 50.

Advancing volume was higher at a ratio of 1.52 to one. The closing TRIN was 0.83 and the final tick was 248. The five day average of TRIN is .98 and the ten day average of TRIN is .8. The NYSE Composite Index lost -0.07% today while the SPX gained 0.08%.

For the NYSE, relative to the previous 30 session average, volume was 87.18% above the average. Of the last 15 sessions 7 sessions ended with volume greater than the previous rolling 30 day average volume. Of the last 30 sessions, 19 sessions ended on a positive tick, 7 of last 10. For the SPX, the day's volume was 100.9% of the average daily volume for the last year. Volume was 105.1% of the last 10 day average and 109.7% of the previous day’s volume.

Breadth was decent for such a small range day. But bulls should find troubling the dropping ten day average of Net Advancing.

Total tick for the day was 184,000 and the average tick for the day was 119. There were 37 ticks greater than 600 and 11 ticks more extreme than -600. There were no ticks greater than 1000 and no ticks more extreme than -1000.

Looking at Friday's intraday volume pattern tells us little but it may be worthwhile to mention that this was the lowest option expiration volume of the year. Checking the nightly breadth indicators also is a bit unenlightening but it should be noted that the Absolute Breadth Index has fallen off the planet, strongly suggesting that we are topping.

For the SPX Index there were 262 Advancers/187 Decliners.  On the NYSE 3,145 issues were traded with 1,706 advancing issues and 1,357 retreating issues, a ratio of 1.26 to one advancing. There were 176 new highs and 22 new lows.  The five day moving average of New Highs is 207 while the five day moving average of New Lows is 67 and the ten day moving average of Net Advancing is 50.

Advancing volume was higher at a ratio of 1.52 to one. The closing TRIN was 0.83 and the final tick was 248. The five day average of TRIN is .98 and the ten day average of TRIN is .8. The NYSE Composite Index lost -0.07% today while the SPX gained 0.08%.

For the NYSE, relative to the previous 30 session average, volume was 87.18% above the average. Of the last 15 sessions 7 sessions ended with volume greater than the previous rolling 30 day average volume. Of the last 30 sessions, 19 sessions ended on a positive tick, 7 of last 10. For the SPX, the day's volume was 100.9% of the average daily volume for the last year. Volume was 105.1% of the last 10 day average and 109.7% of the previous day’s volume.

Breadth was decent for such a small range day. But bulls should find troubling the dropping ten day average of Net Advancing.

Total tick for the day was 184,000 and the average tick for the day was 119. There were 37 ticks greater than 600 and 11 ticks more extreme than -600. There were no ticks greater than 1000 and no ticks more extreme than -1000.

Looking at Friday's intraday volume pattern tells us little but it may be worthwhile to mention that this was the lowest option expiration volume of the year. Checking the nightly breadth indicators also is a bit unenlightening but it should be noted that the Absolute Breadth Index has fallen off the cliff, this strongly suggesting that we are topping.


So the chart pattern tells me that that we are going to breakout of this weekly cup and handle pattern, the move could be substantial possibly 75 to a 100 points, but the stochastics and the internals are saying otherwise. This market has ignored the technicals since the rumors of second QE started in August and with more problems in Europe and here in the US cheap money is finding a home in stocks or ETF's. 


Long: RES 1/2 position, CRUS, AIB, IRE, TBT, GLD, GDXJ, SLV, UEC, URZ, CCJ. 

Friday, December 17, 2010

Thursday Recap: A look inside the market

SPX INTRADAY

Stocks were ready to open a bit higher despite disappointing earnings from FedEx and a bond auction in Spain that once again saw yields rise. The Labor Department reported that initial claims for unemployment insurance for the week ending December 11 fell by 3,000 to 420K. The week’s total was 1K below the Reuters consensus for a reading of 421K. Continuing Claims for unemployment for the week ending December 4 were above consensus at 4.135M vs. expectations for 4.049M and last week’s revised (higher) 4.113M. Housing Starts rose by +0.3% in November to an annualized rate of 555K. This was above the consensus for 545K. The October numbers were revised higher to an annualized rate of 534K from 519K. Building Permits for November fell to 530K. This was below the consensus of 537K and last month’s reading of 552K.


The Thursday session opened with a one point gap higher and carried through for a couple more points in the opening minutes. But mild weakness hit the tape and by 10:03 am the low of the day was painted. The rest of the session gravitated higher with one sudden surge just after 11:00 am that really amounted to the entire day within about ten minutes. Another Ho Hum session, but an 8 point gain. If we look in side the numbers we find Energy, Financials and Technology lagged the SPX on a relative basis. The Stars were the Materials (not Precious metals), and Industrials. 
USD INDEX DAILY

USD INDEX WEEKLY
DXY was off a bit but moved higher through out the day, its hovering right around the 200wk MA, I wouldnt be surprised if we see it move back up to recent high (81.20), if you look at the TLT its way oversold and that should get a bounce. People are going to look at the yields and now they are more attractive so new money should come into the Bonds, and that will be positive for the DXY and negative for gold and silver but let us not forget that people buy metals in other currencies as well, so the effect on metals wont be as dramatic IMHO.


Yesterday, breadth was strongly positive as might be expected on an up day. Advancing volume was not much stronger in advancing issues. The NYSE Composite Index slightly underperformed the SPX. The breadth data from the NYSE today is rather underwhelming.


The McClellan Oscillator is hanging virtually at zero. This will often happen a day or two before a wide range session. So it is possible we see a large day soon.


 I would love for gold to fall down to the 30wkma  (it would get all the weak hands shaken out), I don't think it will happen because lets face it would be too much of a gift! Right now the 10wk has been support over the past 5 weeks or so and the Gold bears can't break that level down, so keep an eye on that for new purchases.


Silver has had great tests of its 20dma Numerous time and has held up like a champ! It hasn't tested its 50dma once since its breakout in August. This is despite the gyrations in the DXY. The DXY was 80.41 at the time of breakout in Silver and its roughly unchanged while Silver is up more than 50% in that time, so what does that tell you about demand!


Thursday, December 16, 2010

Wednesday Recap: A Look Inside the market

Weekly chart holding support above 1220
The combination of Moody's placing Spain on review for a future downgrade and Portugal's miserable bond auction put stocks on the defensive before the open. The Consumer Price Index for November rose by +0.1%, which was below the consensus for +0.2% and October’s reading of +0.1%. When you strip out food and energy, the so-called Core CPI came in with a gain of +0.1%, which was in line with expectations and above October’s unchanged reading. The Empire Manufacturing Index for November rose to 10.57, which was above the consensus expectations for a reading of 3.80 and    above the October reading of -11.14.


Intraday, 5min Chart
This was a pretty ho hum session, not much to speak about but the general trend of higher futures, higher  first hour followed by high volume selling and a late day drift higher seems to be ending. Something to keep an eye on for the short term traders. Looking at the leading sectors today we find the Healthcare and Consumer Staples outperforming significantly relative to the SPX, slight out-performance by Tech, Industrials, while materials, energy, financials and utilities were the laggards. 


The SPX had 127 Advancers/319 Decliners. NYSE 1,040 advancing issues and 2,004 declining issues, a ratio of 1.93 to one declining. There were 156 new highs and 89 new lows. The five day moving average of New Highs is 233 while the five day moving average of New Lows is 73 and the ten day moving average of Net Advancing is 104.

Declining volume was higher at a ratio of 3.06 to one. The closing TRIN was 1.59 and the final tick was -851. The five day average of TRIN is .87 and the ten day average of TRIN is .75. The NYSE Composite Index lost -0.72% today while the SPX lost -0.51%.

For the NYSE, relative to the previous 30 session average, volume was 6.13% above the average. Of the last 15 sessions 6 sessions ended with volume greater than the previous rolling 30 day average volume. Of the last 30 sessions, 19 sessions ended on a positive tick, 7 of last 10. For the SPX, the day's volume was 95.8% of the average daily volume for the last year. Volume was 92.6% of the last 10 day average and 98.2% of the previous day’s volume.

Breadth was negative and declining volume was even more negative. This was the first really large negative final tick since September 21st. The broad NYSE Composite Index performed even worst than the SPX; this is often a bearish clue. Watch for the ten day average of Net Advancing to drop below zero; that may be a signal that the market is in retreat.

Total tick for the day was -68,000 and the average tick for the day was -44. There were 44 ticks greater than 600 and 90 ticks more extreme than -600. There were 1 ticks greater than 1000 and 7 ticks more extreme than -1000. The tick action suggests institutional distribution.

The intraday volume pattern very clearly shows the volume spiked today with each down move; this is not a bullish pattern. Looking at the nightly breadth indicators, things are even more bearish looking than they were the previous night. 


On 12/16/10 am the futures are slightly higher, we see Europe slightly higher along with the Euro against the dollar ahead of an EU summit.The euro bought $1.3232 in morning European trading Thursday, up slightly from $1.3213 the night before in New York.The British pound is up to $1.5566 from $1.5539 while the dollar is down to 84.18 Japanese yen from 84.43 late Wednesday.


The meeting is said to have representatives from EU's 27 states who will be getting together Thursday and Friday amid pressure to find ways out of the smoldering debt crisis.The summit is not expected to make any take new radical decisions, but will likely focus on a change to EU treaties to set up a new crisis mechanism to replace the current euro750 billion bailout fund beyond 2013.

Wednesday, December 15, 2010

Bond market is speaking!

Over the past few weeks I have posted about the breakdown of the US long bond. This has serious implications for all of us. (See yesterday's post for charts)
Judging solely by the price action in both the Ten year and the long bond, the Fed’s QE program, which was designed to hold down long term interest rates and thus spur lending particularly in an attempt to generate activity in the real estate sector, has proven to be a failure. The exact opposite of what was intended by the FED is happening, and when you  combine that with a huge number of houses available due to the wave of foreclosures and it is difficult to see this turning around any time soon. The plan was to artificially force down longer term rates through the purchase of Treasuries which would spur bank lending and consumer spending and business growth, and hiring etc. 
How that is going to happen when the rates are going in the opposite direction? The bond holders are speaking loud and clear, they are not going to hold these bond because they see the inflation, charts don't lie.The simple fact is that the CCI (Continuous Commodity Index) is soaring now has fully captured the attention of the bond market and unless the easy money policy is withdrawn, there will be never ending wave of selling, so short the long bond or go long TBT or TBF.
The long holdout on the FOMC, Governor Hoenig has had it right all along he has been the dissenting voter in the FED he has voiced his strong opinion on the potential for strong inflationary pressures as a result of QE. The Fed has has kept the stock market propped up and and the cheap money is finding a home for now in stocks. The other effect its having is over inflating commodity prices and that is a great cost to us all and especially to the unemployed or those just getting by. 
The next troubling thing I am seeing is that rates are rising in the 5 year, which means that the government is going to have to borrow more and more on a short term basis in order to fund its ballooning budget deficit and its rising entitlement costs if it wants to keep its borrowing costs low. That may work for a while but the fact is that a nation so deeply in debt as we are we are now at the mercy of market forces that could drastically force yields upwards, meaning the cost of carrying this mountain of debt grows larger with each passing month. In other words, our creditors are going to be demanding more money to support us. I don't know how this can play out without it getting ugly.
The speed at which the bond market is breaking down is startling. The problem with markets which begin to act like this is that often times that selling begins to feed on itself and a frenzy to unload commences. It may or may not happen to the bonds but the risk is there. Quite frankly, there is only one line of support I can see on the price charts near the 119 level that is standing between the long bond and a drop below 115. If it gets down into that region, things are going to get really scary.
Having experience with the tech bubble, the housing bubble, the mortgage and financial meltdown has given me a different way to look at the information I am fed by politicians and media. Seemingly I wasn't the only one blindsided by those events, don't get fooled by action in the SPX, its not about a growth cycle, or jobs or prosperity worldwide.
Long TBT

Tuesday SPX Recap

Despite a weak bond auction in Spain and disappointing earnings from Best Buy the bulls kept control of the morning session. The Labor Department reported the Producer Price Index (an indication of inflation at the wholesale level) for November rose by +0.8%, which was above the consensus estimate for +0.6% and above October’s +0.4%. When you strip out food and energy, the so-called Core PPI came in up +0.3%, which above the consensus for +0.2% and October’s +-0.6%. The Commerce Department reported that Retail Sales rose in the month of November by +0.8%. This was above the consensus for +0.6%. When you strip out the sales of autos, sales were up nicely at +1.2%, which was double the consensus for an increase of +0.6%. Sales for the month of October were revised higher to show a gain of +1.7% from the initial reading of +1.2%. Excluding autos, October sales were revised higher to +0.8% (from +0.4%). I love that, when you strip out food and energy, makes me laugh every time.

The Fed day session opened with an insignificant gap higher. As is the norm on Fed days, the morning drifted higher but the reality is that the market simply was waiting for the announcement as if something would be revealed. The announcement came and the market reaction was rather muted. The high of the day was quickly painted on the chart during the initial gyration but it quickly gave way to a more lasting move as the second gyration was downward. But everything today was within a tight range so any lasting effect seems questionable.

Looking at our Market Leaders, Industrials, tech, consumer staples, utilities and healthcare. Laggards were Financials, Chips, China, Germany, Materials, and Energy.


For the SPX Index there were 240 Advancers/205 Decliners. On the NYSE 3,158 issues were traded with 1,352 advancing issues and 1,711 retreating issues, a ratio of 1.27 to one declining. There were 179 new highs and 113 new lows. The five day moving average of New Highs is 244 while the five day moving average of New Lows is 60 and the ten day moving average of Net Advancing is 373.

Declining volume was higher at a ratio of 1.35 to one. The closing TRIN was 1.06 and the final tick was -233. The five day average of TRIN is .64 and the ten day average of TRIN is .62. The NYSE Composite Index gained 0.07% today while the SPX gained 0.09%.

For the NYSE, relative to the previous 30 session average, volume was -8.74% below the average. Of the last 15 sessions 5 sessions ended with volume greater than the previous rolling 30 day average volume. Of the last 30 sessions, 20 sessions ended on a positive tick, 8 of last 10. For the SPX, the day's volume was 89.7% of the average daily volume for the last year. Volume was 95.1% of the last 10 day average and 95.2% of the previous day’s volume.

Negative breadth and negative volume. But the real news here is what’s happening to the New Lows. The two day total of New Lows is 200; we haven’t seen these numbers since late August when the SPX was 200 points lower. This is a powerful clue that something is out of whack. (This is the Hindenburg Omen again.)

Total tick for the day was -95,000 and the average tick for the day was -61. There were 7 ticks greater than 600 and 72 ticks more extreme than -600. There were no ticks greater than 1000 and 9 ticks more extreme than -1000. The tick action suggests institutional distribution.

There's no real significance to today's intraday volume pattern as we see the typical Fed day pattern of low volume just before the announcement and then the spike along with the gyrations. The real significance on this graphic is when we check the nightly breadth indicators. The first three lines of that data when taken together are quite bearish looking. The Absolute Breadth Index is strongly suggesting that we are topping. The Cumulative Volume Index dropped on an up day; a significant bearish signal. 


Tuesday, December 14, 2010

SPX Recap

All moving averages on the daily in up mode, weak support at 1220 was looking like a top was forming here last week as I wrote on Monday based on the data presented. We keep sweeping the dirt under the rug in terms of debt, spending and taxes, its all going to end badly but keep dancing while the band plays. (Click chart to enlarge)


Things were quiet in the early going but the mood remained upbeat. Overseas markets were higher across the board as traders were pleased that China decided to raise only the bank reserve requirements as opposed to raising interest rates. There wasn't a single entry on the economic calendar today either here at home or in Europe so a slow trading day was anticipated.

The week opened with a two point gap up and quickly surged two more points. The SPX traded gently higher in a very tight trading range until the high of the day was put on the chart at 2:48 pm. But the final seventy minutes saw some selling as the index gave up six points. After the recent action, a six point sell off felt much larger than life.


Market Leaders Metals, Other Materials, Energy Issues, Healthcare and Utilities were mostly higher, yet some interesting divergences downward as some key leaders struggled today. The Russell 2000 (small caps), the Financials (XLF), and the SOX (chip makers) all closed lower today and they have been leading this new leg up so this change lead a pullback in the markets.


I continue to anticipate something of a pullback, my technical calls for a top are being proved wrong day after day, but with all the money thats being printed its gonna find its way into ETF's, Commodity Stocks etc. Tomorrow's FED announcement might possibly be the catalyst needed and is certain to dominate the afternoon. But the possibility that pre-holiday low volume allows the market to drift higher can not be ignored, either. There is plenty of risk on both sides here.


For the SPX Index there were 201 Advancers/239 Decliners. On the NYSE 3,150 issues were traded with 1,443 advancing issues and 1,608 retreating issues, a ratio of 1.11 to one declining. There were 271 new highs and 87 new lows. The five day moving average of New Highs is 233 while the five day moving average of New Lows is 41 and the ten day moving average of Net Advancing is 310. The Net Advancing data indicates a bullish trend.

Advancing volume was higher at a ratio of 1.35 to one. The closing TRIN was 0.67 and the final tick was 147. The five day average of TRIN is .53 and the ten day average of TRIN is .60. The NYSE Composite Index gained 0.34% today while the SPX lost 0%.

For the NYSE, relative to the previous 30 session average, volume was -8.23% below the average. Of the last 15 sessions 5 sessions ended with volume greater than the previous rolling 30 day average volume. Of the last 30 sessions, 21 sessions ended on a positive tick, 9 of last 10. For the SPX, the day's volume was 94.7% of the average daily volume for the last year. Volume was 102.1% of the last 10 day average and 100.2% of the previous day’s volume.

Breadth was negative yet advancing volume was positive. New Highs rebounded. The broad NYSE Composite Index outperformed the SPX. Kind of a mixed bag on the NYSE but look at the TRIN. That ten day average of the TRIN is almost unheard of.

Total tick for the day was -79,000 and the average tick for the day was -51. There were 4 ticks greater than 600 and 28 ticks more extreme than -600. There were no ticks greater than 1000 and no ticks more extreme than -1000. The tick action suggests institutional distribution.

Intraday volume patterns today are clearly a bit worrisome for bears. Volume surged on up moves and really did not surge much during the closing hour sell-off (this is a complete reversal of what I wrote yesterday (about last week). The nightly breadth indicators are a bit more encouraging for the bears as the overall look of the indicators really suggests a topping process. The Absolute Breadth Indicator is moving lower while the High Low Logic Index has jumped to 1.51. Notice also that the McClellan ten day average still has just now managed to cross above zero.


No Change in Long-term out look. Bull market inside a secular bear continues! Waiting for the big bear to rear its ugly head. 

Bond Update

US 30 Yr. (click to enlarge)

With the issuance of new paper and impending inflation and continued dollar debasement foreign debt holders are dumping US treasuries and rushing into commodities like Gold and Silver. The Long bonds started to fall even before this round of quantitative easing and now have fallen off the proverbial cliff. In the past the 30 year has been supported at the 200wk ma, but a break of that could lead to further pressure downwards. I think thats is what were going to see because Bernake has already hinted at QE3 (on 60 minutes). He also got Mr. all talk and no action to extend the Bush tax cuts which is another form of QE. If it were not for the problems in Europe the dollar index (euro heavily weighted) would have crashed and there would have been wide spread panic and gold would be above 2000, Oil at 150 etc.


20 Year Bond Fund

3-7 Yr Bond fund

There were rumors that Fed has been manipulating the bond market with the help of JPM asking them to short the short the shorter term paper and go long the long bond and they are getting money from the Fed to do that. I am no conspiracy theorist but I wouldn't put anything past these guys. It would be naive to think this type of stuff doesn't happen. Anyway, the way to play it is to either short the TLT or IEI or go long TBT or TBF, which I wrote about a few weeks ago. Since then the TBT is up over 20%. 

TBT is a long term (Secular Trend) play, with the theory that there will be a debt crisis in the US (11 trillion and rising), failing states (NY and California whose GDP is larger than most eurozone countries, heck Alabama's is larger than Ireland) given all this printing and ZERO job creation, rampant inflation and artificial low yields and eventually default of debt etc. This will take years to play out, and I hope it doesn't happen. But this is what the charts are telling me is going to happen. Charts don't lie, people do. 


Dollar and Inflation


Commodity prices are soaring, watch the inflation data coming out this week, Data manipulated to show no inflation because we need to keep printing! Inflation what inflation. Except for oil which was at 150 at the collapse of Lehman most other commodities are right at 2008 highs or making new all time highs. They keep lying to our face its the same old song. "We won't get fooled again".  I put up a few charts below to highlight what i'm talking about, you can find the rest on stockcharts.com. 


CRB Commodity index at 2008 highs, Copper, Gold and Silver at all times highs recently.


Copper


Cotton


Coal

Sugar

It is my belief that the price of certain commodities isn't moving higher because of supply/demand factors. Prices are moving higher because cheap created by the US Fed and Euro QE (Greece, Ireland, Spain, Portugal, Italy, France) programs. Yesterday the Chinese left interest rates unchanged, Hedge funds cheered, and the buying continued. Commodities are now officially back in bubble territory but as long as the easy money flows, they will move higher.
It is investment demand (money needs to find a home) not supply demand, for example copper isn't going higher due to higher construction demand. Wall Street in its greed has created a whole cornucopia of ETF’s that are commodity related and the money is finding a way there. 
Caution: The nature of these flows is that they are extremely fickle and quite vulnerable to any news or action on the part of monetary authorities to go after the speculators. I am not sure that there is much any of them can do as long as we have free money available for leveraged plays so stay a while with one foot out the door (anything Industrial related Aluminum, copper, steel etc). 

Monday, December 13, 2010

UUP

I wrote about this on twitter the other day as I was adding to metals that once the gap is filled watch for  print of the HNS pattern, been correct so far, completes at previous lows to left. For those trading commodity issues this obviously is a significant relationship. (click on chart to enlarge)

CRUS

Finally re-opened a position today, I bought the breakout end of march and sold it for almost a double at around 16 got sucked in a little on that inverted hammer but since have been waiting patiently for this one (This is a great story, do your DD). I know I have written about a top in the SPX for a few days and I have been wrong.I trade the market I have been given not the one I think I should have. Its OK to be wrong as I have learned just don't stay hell bent on an idea if its not working. If this closes below the 150dma i'm gone. In the tech collapse I went short numerous times but always at the wrong time and similarly in the financial crisis. I kept shorting the banks way longer than I should have, gave a lot away. Because i was fixated on the news, when I should have been watching the price action. Charts don't lie to you. 

Luck O' the Irish Follow up AIB IRE

This has been a very profitable investment (only on a percentage basis) to this point. But I could wake up one morning and find a situation like Lehman. But then again I think the market cap in these is so small (don't need a lot of money to save them) and they have exposure to whole of Europe. I don't think anyone is gonna let these go under (but thats what I thought when two days before Lehman went down I bought a few thousand shares OUCH! In the words of Roger Daltrey (The Who), "WE WONT GET FOOLED AGAIN"

So here is my play book

25% position bought at white arrow, rest bought over three days cost basis 2.17. Have a 33% gain at the moment. It has support at 2.6 where i'm out completely, not taking any chances shoot first ask questions later. New buys close to that level. Hold and pray. 5 years from now when Europe is doing a lot better than the US these banks will be a lot higher. Ireland is a small country of very educated people, one of the highest per capita ed. in the world live there. They will do what it takes to survive IMHO.

Cost basis of 1.15. Its been under performing IRE. But there is a nice cup and handle here but it certainly look weak. I don't trust this stock like I do IRE don't like the recent sell off, but if it can hold that support to the right of the chart I stay in. If it breaks out you could easily see above1.8 in the near term." Good Luck mi laddies"!!


Addendum: 12/14/10 AIB this morning announced it won't pay bonuses! Did that happen when the US banks were bailed out NO FREAKIN WAY!! Mr. Thane went and spent 8 million in office furniture, AIG went on expensive vacations and Mr. Lewis got six million in Xmas bonus while the shareholders lost billions. There are many more examples of these type of shenanigans! 

SLV follow up 60min Daily Chart

Beautiful move off the 27.34 sell off multiple retest of that level, nice gap up watch for support around 28.30 for any new buys. New target 32.5, time frame 7trading sessions (needs to clear 29 first). I will re-evaluate. Long-term add on significant dips and they are sure to come in this metal.

Gold and Silver Update

There was technical damage done to the gold chart last week with the price trading below the 10dma, short term thats negative. Gold has support at the 20dma but the average has turned from up to down. If you are a short-term trader then you must watch this 20dma level. To scare of the bears, gold need to stay above 1400 but a break below 1380 will cause further selling probably down to next support at 50dma. All this being said from what I am reading there is tremendous demand in the physical market for both gold and silver and there are rumors that JPM or someone that big is the major seller at the behest of the Fed. The big Asian buyers are the ones that see the game the FED is playing and are buying the dips . The print and spend Jig will be up soon enough!


The Silver chart looks similar to the gold chart but is stronger on a technical basis. While gold is testing its 20dma Silver is firmly above it and though there is a slight turn down of the 20dma in silver not as pronounced as gold. Further more the sell off in Silver this time wasn't like the one in November. In November volume spiked 5x normal and this time around it wasn't even close to double. So in my opinion this was clearly profit taking. The long-term trend is in tact and I did some buying on the pull backs. Remember to sell small amounts as we go up and buy the dips.

Calling a top


I believe the the markets are being manipulated, we can all agree that the trend has been to wake up see the futures higher every day. Then at the open there is higher relative volume and stocks sell off and later in the day buyers come in or is that all the sellers are gone for the day and the market rises.


This is a nice theory but I will present some evidence in support. 


1. TICKS: Lets talk about Ticks, no not the parasite but as it relates to the markets. For those of you who are new or just curious you can find answers in Investopedia or click the link. (http://stocks.about.com/od/evaluatingstocks/a/091309TICK.htm). On Monday and Friday, extreme ticks favored the bulls by a wide margin, 83 to 31. Monday's session moved down after the open, recovered quickly, moved down once again, and then spent most of the session recouping loses. Friday's session had the expected early move lower then spent the rest of the day crept higher. These numbers are actually quite unconvincing for a two-session total but bulls in control 2:1 ratio.

Now let's examine the Tuesday, Wednesday, Thursday sessions. On these days the extreme ticks were 81 for the bulls and 241 for the bears, a three-to-one ratio certainly more convincing numbers when compared to Monday and Friday. Yet each of these days closed in the plus column. All three sessions had the early morning dip after gaps higher as sellers took advantage of the gaps. Then the dip buyers bid the tape back up higher later in the day.

For the week, extreme ticks were 164 for the bulls and 272 for the bears and the ticks greater than 1000 were none for the bulls and six for the bears. This is clearly evidence of institutional computers selling hard, not buying. 


Caution: I'm willing to bet it's the same computers that are bidding the futures higher overnight. And we're suggesting that when they are through distributing, they'll quit the overnight bidding... and then the dip buyers run the risk of being left holding the bag. 

2. SENTIMENT: No not a nostalgic romantic feeling but the feeling that is felt by many people in this case bulls or bears.  Friday’s ISEE Sentiment Index closed at 230, which is the highest reading since January 30, 2006. The ISEE Equity Only closed at 343, the highest since April 15th. The ten day average of the ISEE Equity Only is at 245, just below the 249 high of April 15th. 


3. TRIN: No not Trinidad, as the locals call it but the advancing issues divided by the declining issues, divided by the volume of advancing issues, divided by the volume of declining issues. The ten day moving average of NYSE TRIN closed at .604 today, which is the most overbought reading in more than twenty years. The ten day average of the Put/Call ratio is at .74. When you combine all these we are at historic levels of overbought, levels seen rarely in history.

So to my friends on twitter be very cautious is you are long I believe that we are within ten points of a significant top. I base this judgment on the above data as well as other breadth data . Tops are notorious for lingering; they do not form the same way as bottoms form. 


Dollar trying desperately to hold wk-ma 
Friday Recap
In spite of another hike in China's reserve requirement, things were stable in the pre-market with futures pointing modestly higher once again. The government reported that Import Prices for the month of November rose by +1.3%, which was higher than the consensus for an increase of +0.8%. Export prices rose by +1.5%, above expectations for +0.6%, and above last month’s unrevised +0.8%. The U.S. Trade Deficit fell in October to $38.7 billion, which was below the consensus estimate for a deficit of $42.9 billion.

The final session of the week began with a small one point gap higher but within moments was three points higher. The SPX traded sideways for most of the opening thirty minutes before making a quick fifteen minute four point plunge that appeared to many traders as setting the tone for the day. But sentiment quickly reversed and the index spent the rest of the session working slowly higher with nothing as large as a two point decline the rest of the session as bulls once again owned the tape and allowed bears nothing at all.


The SPX gained 15.69 points during the week. The four week RSI of the four indices (SPX, Dow, NASDAQ, and Russell 200) is 82. Pullbacks often occur as this RSI reaches 80 and bounces near 20.

For the SPX, there were 291 components advancing and 158 declining. Total tick for the week was 34,000. The number of components with their 5 DMA above their 20 DMA increased during the week from a ratio of 3.86 to one to 8.02 to one.

On the NYSE, the advance/decline line increased slightly during the week by 529 and the 10 DMA of Net Advancing increased from 214 to 279.

Volume for the week was the highest since the week of June 28th.


For the SPX Index there were 339 Advancers/106 Decliners. On the NYSE 3,154 issues were traded with 1,969 advancing issues and 1,096 retreating issues, a ratio of 1.8 to one advancing. There were 203 new highs and 49 new lows. The five day moving average of New Highs is 212 while the five day moving average of New Lows is 26 and the ten day moving average of Net Advancing is 279. The Net Advancing data indicates a bullish trend.

Advancing volume was higher at a ratio of 3.27 to one. The closing TRIN was 0.55 and the final tick was 758. The five day average of TRIN is .61 and the ten day average of TRIN is .61. The NYSE Composite Index gained 0.53% today while the SPX gained 0.6%.

For the NYSE, relative to the previous 30 session average, volume was -9.25% below the average. Of the last 15 sessions 6 sessions ended with volume greater than the previous rolling 30 day average volume. Of the last 30 sessions, 20 sessions ended on a positive tick, 8 of last 10. For the SPX, the day's volume was 98.7% of the average daily volume for the last year. Volume was 105.5% of the last 10 day average and 102.1% of the previous day’s volume.

The oddity in the above data is the New Lows for Friday; double the New Lows from Thursday. Notice the TRIN data.
Total tick for the day was 154,000 and the average tick for the day was 99. There were 56 ticks greater than 600 and 19 ticks more extreme than -600. There were no ticks greater than 1000 and no ticks more extreme than -1000.


No Change to my positions except that I added to GLD and SLV on the strength of the dollar and big pull back.


Have a great week everyone