Friday, November 26, 2010

Wednesday Recap: A Look Inside the market


Before the open the Labor Department reported that initial claims for unemployment insurance for the week ending November 20 fell by 37,000 to 407K. The week’s total was 20K below the Reuters consensus for a reading of 437K. Continuing Claims for unemployment for the week ending November 13 were below consensus at 4.182M vs. expectations for 4.278M and last week’s revised (higher) 4.324M. Orders for long-lasting goods rose in October. The Commerce Department reported that Durable Goods orders fell by -3.3% during the month, which was below the consensus expectations for -0.4%. When you strip out the volatile orders for transportation, orders fell by -2.7%, which was below the consensus for +0.5%. The September reading was revised higher to+1.3% from -0.4. Personal Incomes rose by +0.5% in October, which was above the consensus expectations for an increase of +0.4% and the September level of -0.1%. Personal Spending for the month rose by +0.4%, which was below the expectations of +0.5% and the September reading of +0.3%. Futures were much higher pointing to a strong open.

The Pre-turkey day rally started by climbing ten points within five minutes of the open. But the most the move began just after 10:15 am. From 10:14 through 10:50 there were zero ticks as the index began a powerful advance  as buyers simply overwhelmed sellers in the pre-holiday low volume. The remainder of the session consolidated higher with the high of the day in the last moments of the session.

Looking at the market Leaders we see the all the leaders closed higher. There are a couple of conflicts in the leaders that are noteworthy. First, the Financial Sector (XLF) continues to stand out by being more than 14% off the 52 week highs. It is a rare rally that can continue without the full participation of the financials. Yet, on the other hand, the chip makers (SOX) and small caps (Russell 2000) are less than 1% off their 52 week highs. The SOX, small caps, and financials are often the strongest market leaders and this conflict among the leaders would seem to suggest ongoing choppy tug-of-war range-bound trading until this sorts itself out.


Market breadth has begun to suggest that we test the highs again before year end. The action of the moving averages suggests that the pullback here will be shallow. The possibility of a quick early December test of the 1165 area seems likely before moving back upward.


For the SPX Index there were 453 Advancers/33 Decliners. On the NYSE 3,139 issues were traded with 2,527 advancing issues and 520 retreating issues, a ratio of 4.86 to one advancing. There were 144 new highs and 10 new lows. The five day moving average of New Highs is 75 while the five day moving average of New Lows is 19 and the ten day moving average of Net Advancing is -193.


Advancing volume was higher at a ratio of 10.2 to one. The closing TRIN was 0.48 and the final tick was 760. The NYSE Composite Index gained 1.45% today while the SPX gained 1.47%.


For the NYSE, relative to the previous 30 session average, volume was -21.62% below the average. Of the last 15 sessions 7 sessions ended with volume greater than the previous rolling 30 day average volume. Of the last 30 sessions, 20 sessions ended on a positive tick, 5 of last 10. For the SPX, the day's volume was 73.6% of the average daily volume for the last year. Volume was 75.7% of the last 10 day average and 79.6% of the previous day’s volume.


Powerful market breadth was even more positive than Tuesday was negative. The ten day average of Net Advancing moved above -200 which might suggest that this pullback is ending; it bears watching.


Total tick for the day was 282,000 and the average tick for the day was 182. There were 149 ticks greater than 600 and 10 ticks more extreme than -600. There were 7 ticks greater than 1000 and no ticks more extreme than -1000. The tick action suggests institutional accumulation.


The Tick action on Wednesday was very positive if you are a bull. Large upward session but from 10:15 through 10:50 in those  35 minutes there wasn't a single negative tick, which isn't all that rare, but the tick averaged over 600 during that time. was rare tick action; the type of action that occurs only a few times per year. This most frequently leads to a longer-term rally. But it is worthwhile to notice that this ramp occurred on falling relative volume which is also as bit unusual. Still, if you are bearish, you must take note of such unusual activity.


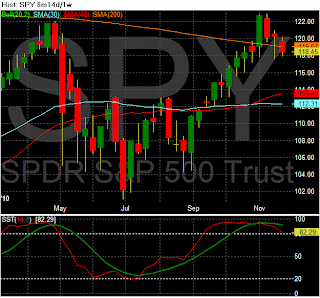
And as I stated Tuesday the dollar is right up against its 200wk move, and now closed up above it. There is a lot of room in this move as the stochastics are near the bottom of this range. I don't think the technicals matter so much as the news does. This has been a strange market if you are a technician like me. Its been hard to trade. Anyway, I am picking my spots. I have been right lately in picking when to short lately and I feel more in tune with the markets.


Above 200wkMa but below the 30wkMa, this would be more bullish for the dollar
 if the 200Wk was above the 30wk, I think we test the 30wk and pullback


Looking at the futures, it appears its going to be a dismal day if you are bullish as the SPX futures are down 1%. Oil and Gold are also down due to dollar strength. There is more bad news out of Europe, the Euro is down one percent. Yes of course banking troubles, national debt, bad loans, big spending governments, oh and whats this Portugal is denying it will need a bailout (that is funny).  European markets are down and the Asian markets closed lower. Dollar is up against the Euro, GBP, and the Yen. Oh and North Korea reportedly warned that further naval exercises by the U.S. and South Korea will bring the region closer to war.




Wednesday, November 24, 2010

Tuesday Recap: A look inside the market


Closed Below 200wkMa
The North Korean attack, Ireland's/European banking woes brought a lot of fear into the markets on Tuesday. At 830am the GDP was released it showed the economy grew at an annualized rate of 2.5% in the quarter. This was above the consensus expectations for a growth rate of 2.4%. The consumer activity, the Personal Consumption component of the report came above expectations with a gain of 2.8% vs. 2.5%. And on the inflation front, the Deflator came in at 2.2% vs. 2.3%. We had a heavy plunge downwards at the open this was followed by two weak attempts to push the market higher but they failed. The buying of the dips isn't working like it was last couple of months.

Gold was strong as you might expect but small caps and semiconductors were relatively strong as well.For the SPX Index there were 34 Advancers/455 Decliners. On the NYSE 3,130 issues were traded with 681 advancing issues and 2,379 retreating issues, a ratio of 3.49 to one declining. There were 37 new highs and 31 new lows. The five day moving average of New Highs is 72 while the five day moving average of New Lows is 21 and the ten day moving average of Net Advancing is -322. The Net Advancing data indicates a bearish trend.


Declining volume was higher at a ratio of 11.04 to one. The closing TRIN was 3.16 and the final tick was -390. The NYSE Composite Index lost -1.83% today while the SPX lost -1.45%.


For the NYSE, relative to the previous 30 session average, volume was -4.94% below the average. Of the last 15 sessions 8 sessions ended with volume greater than the previous rolling 30 day average volume. Of the last 30 sessions, 20 sessions ended on a positive tick, 5 of last 10. For the SPX, the day's volume was 83.4% of the average daily volume for the last year. Volume was 94.2% of the last 10 day average and 103.9% of the previous day’s volume.


Breadth was strongly negative today and the strength in declining volume was severely negative for the markets. The broad NYSE Composite Index fared significantly worse than the SPX suggesting that we have even more work to the downside yet to come.


Total tick for the day was -58,000 and the average tick for the day was -38. There were 77 ticks greater than 600 and 95 ticks more extreme than -600. There were 8 ticks greater than 1000 and 6 ticks more extreme than -1000.


Todays tick pattern resembles a bottoming may be occurring but this isn't as convincing as I'd like. The intraday volume pattern clearly spiked with every downward move; this often leads to even more selling. The breadth indicators are quite bearish again. The McClellan Summation Index  has moved half way towards zero since its peak on November 9th. Any move below zero on this indicator would signal a significant pullback in progress similar to the end of August. 
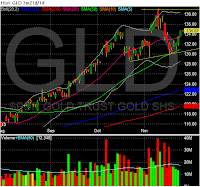
As you can see precious metals still look good, Silver was down today while Gold was up. The trend has been the reverse since early October. Silver has significantly outperformed Gold YTD and since 10-6-18 Gold was up 2% while silver was up 18%. Something to keep an eye on.
Looking for an entry point, was hoping to get one during this sell-off but no such luck as yet!
Looking for entry above 30wkMa
Watch support levels, this is up big in a short period of time so as the market sells off
people will take profits aggressively.


Tuesday, November 23, 2010

Monday Recap: A look inside the market


The Futures are down this morning due to North Korean Military exercises/action over night. So we will test yesterday's lows but we do have GDP at 830 am and that may effect how we open.

As for yesterday early optimism surrounding the announcement that Ireland will accept assistance from the EU/IMF in order to help prop up the banks the government supported during the Credit Crisis faded before the session. European markets turned lower and dragged U.S. stock futures down with them.

The week began with a volatile session which opened under pressure and quickly moved down seven points in the opening moments. But buyers quickly drove the SPX sharply higher and the high of the day was painted on the chart around 10am almost at breakeven. Then we went  sideways for twenty minutes, then index gave back the seven points within minutes before stabilizing in a narrow zone for two hours. Halfway through the lunch the index was hammered for a seven point loss in a few minutes. some computer probably got turned on. The rest of the session was a pretty steady climb back to close near the highs of the day.

In the SPX Index there were 255 Advancers/228 Decliners. On the NYSE 3,136 issues were traded with 1,527 advancing issues and 1,500 retreating issues, a ratio of 1.02 to one advancing. There were 113 new highs and 20 new lows. The five day moving average of New Highs is 98 while the five day moving average of New Lows is 42 and the ten day moving average of Net Advancing is -291. The Net Advancing data indicates a bearish trend.

Declining volume was higher at a ratio of 1.51 to one. The closing TRIN was 1.54 and the final tick was -100. The NYSE Composite Index lost -0.4% today while the SPX lost -0.16%.

For the NYSE, relative to the previous 30 session average, volume was -14.06% below the average. Of the last 15 sessions 8 sessions ended with volume greater than the previous rolling 30 day average volume. Of the last 30 sessions, 21 sessions ended on a positive tick, 5 of last 10. For the SPX, the day's volume was 83.1% of the average daily volume for the last year. Volume was 90.8% of the last 10 day average and 103.8% of the previous day’s volume.

Breadth was weak but positive on the NYSE while declining volume was greater than advancing volume. The broad NYSE Composite Index slightly outperformed the SPX yet we closed with a negative final tick. Mixed signals abound.

Total tick for the day was 122,000 and the average tick for the day was 79. There were 144 ticks greater than 600 and 92 ticks more extreme than -600. There were 5 ticks greater than 1000 and 8 ticks more extreme than -1000.

Intraday volume clearly spiked on the down moves and tailed off on the up moves today. The nightly breadth indicators simply didn’t move much today. 

Precious metals, other materials were strong, as was Tech. Energy and Financials kept the SPX in the red today. 

As i mentioned yesterday its a holiday shortened week, expect low volume and sideways to up action, NEWS is king as we see this am. 

Gold and Silver should do well this week with Gold getting up over 1365 this am. I like seeing the dollar up and Gold up at the same time. 

Monday, November 22, 2010

$CRUS


Weekly chart shows a cross over in the Slow stochastics with move up in price. Looking long above 150dma. Company has great funde's, was beaten down after earnings disappointment but was priced to perfection at that point. 

$DXY


as you can see from the chart sustained moves in the dollar index vs. foreign currencies occur with the cross of the 200wkMa. This will be key for me while holding my commodity basket of GLD, DBA, SLV, XLE , I don't think we get above that 200wk, in fact I am all in we don't!

RES

As I wrote previously I think this stock could double in 12 months, its in the right industry given the inflation thats coming. The stock pulled back big time last week as GS put it on sell list. The stock is up 139% since June and its all due to improvement in earnings. The past of stock price appreciation should slow but I see no blow off top here as yet, and the trend is my friend (for now). If it goes below that support line then I'm out until I see 23.50. 

Friday Recap "A look inside the market"


It was an options expiration event without any economic news to deal with. In the early going, the futures were down in response to a report that French and German officials are pressing Ireland to increase taxes in return for a bailout. The market also found reason to retreat on the news that China had increased its banking reserve requirement.

It was a pretty boring day inside the SPX except for the first hour or so. We saw a three point gap down with a lower volume sell down another six points followed by a slow and steady higher highs throughout the day. Volume was very low especially given that it was options expiration. 


The SPX gained 0.52 points during the week.  The weekly range was 34.43 points, 3%. 

The four week RSI of the four indices (SPX, Dow, NASDAQ, and Russell 200) is 65. Pullbacks often occur as this RSI reaches 80 and bounces near 20.

For the SPX, there were 265 components advancing and 223 declining. Total tick for the week was 112,000. The number of components with their 5 DMA above their 20 DMA decreased during the week from a ratio of 1.65 to one to a ratio of 3.75 to one with their 5 DMA below their 20 DMA.

On the NYSE, the advance/decline line increased during the week 602 and the 10 DMA of Net Advancing dropped from 77 to -319. The last week that closed with the ten day average Net Advancing this low was in early July.
For the SPX Index there were 315 Advancers/164 Decliners. On the NYSE 3,142 issues were traded with 1,794 advancing issues and 1,240 retreating issues, a ratio of 1.45 to one advancing. There were 85 new highs and 21 new lows. The five day moving average of New Highs is 116 while the five day moving average of New Lows is 48 and the ten day moving average of Net Advancing is -319. The Net Advancing data indicates a bearish trend.

Advancing volume was higher at a ratio of 1.44 to one. The closing TRIN was 1.01 and the final tick was 825. The NYSE Composite Index gained 0.28% today while the SPX gained 0.25%.

For the NYSE, relative to the previous 30 session average, volume was 3.74% above the average. Of the last 15 sessions 8 sessions ended with volume greater than the previous rolling 30 day average volume. Of the last 30 sessions, 22 sessions ended on a positive tick, 6 of last 10. For the SPX, the day's volume was 79.9% of the average daily volume for the last year. Volume was 83.6% of the last 10 day average and 84.2% of the previous day’s volume.

Total tick for the day was 184,000 and the average tick for the day was 119. There were 100 ticks greater than 600 and 29 ticks more extreme than -600. There were no ticks greater than 1000 and no ticks more extreme than -1000. The tick action suggests institutional accumulation.

Extremely weak volume after the typical options expiration heavy volume at the open; no intraday pattern is discernable. The nightly breadth indicators were unimpressive and do not show strength nor weakness. 

The weekly chart painted an almost perfect wide-range doji with the close in the upper quadrant of the range. This is a typical chart pattern of a short-term bottom. But i have two major problems with this one is that the ten day net  Advancing Issues continue to decline and and the tick action was not suggestive a bottom formation.


Again in-terms of bottom I am referring to this recently leg down off of the 1225 high. So what I expect to see is sideways choppy action in the SPX but the real action is happening elsewhere (comodity stock)


As for commodity stocks Silver was on fire again but gold and other issues lagged. Gold is forming a base and pattern looks ripe for entry and a test of the recent highs.