Friday, November 05, 2010

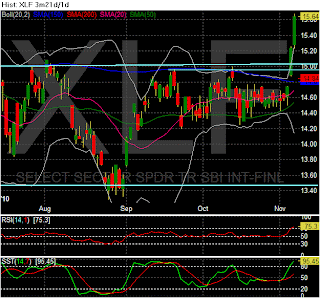
XLF Play this volatility squeeze


Bollinger Band volatility squeeze and, a pinch followed by pop up!!

So you missed this move? Its not too late to get in!

These moves can be multi week moves and so I believe its not to late to enter. Here's what I would do You buy in parts. Say you buy at some point today, you put in a stop at slightly 15, major support there. And you add on pullbacks till you put in the amount you would have put in at the breakout. Good trading.


Thursday Recap: A Look inside the markets


Good Morning everyone!


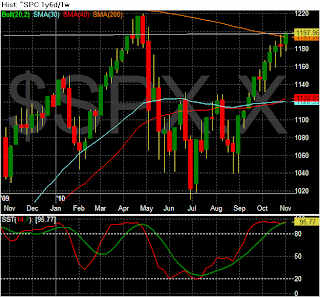
What can I say but "what a day it was". The SPX is above the 200wkma, breaking out, as are many of the sectors and emerging markets as well but the biggest mover are in Silver, Gold related stocks and other commodities softs and hard. 


Notice the volatility squeeze, the" pinch and pop"!, this is a rare and powerful signal. Look for more gains in the near term, buy dips!


Lets look inside the SPX. The post-Fed session began with a huge ten point gap higher and simply never looked back all day as bears were simply torched all day long. There was no escape for shorts as the few pullbacks were shallow and almost meaningless; there were no sellers.


Yes, the equities are overbought. But that does not mean to sell or to short the market. The largest moves often come at the most extremes of overbought and oversold.


Event tough most sectors are giving a buy signal, except for the XLF This does not mean to rush out and Buy tomorrow morning. But it does tell us to exit shorts (if you have them) on any pullback; dips are bought until the momentum turns.


For the SPX Index there were 454 Advancers/35 Decliners. On the NYSE 3,135 issues were traded with 2,569 advancing issues and 493 retreating issues, a ratio of 5.21 to one advancing. There were 569 new highs and 5 new lows. The five day moving average of New Highs is 219 while the five day moving average of New Lows is 11 and the ten day moving average of Net Advancing is 476. The Net Advancing data indicates a bullish trend.

Advancing volume was higher at a ratio of 9.16 to one. The closing TRIN was 0.57 and the final tick was 1182. The NYSE Composite Index gained 2.29% today while the SPX gained 1.89%.

For the NYSE, relative to the previous 30 session average, volume was 31.34% above the average. Of the last 15 sessions 7 sessions ended with volume greater than the previous rolling 30 day average volume. Of the last 30 sessions, 24 sessions ended on a positive tick, 8 of last 10. For the SPX, the day's volume was 124.0% of the average daily volume for the last year. Volume was 131.3% of the last 10 day average and 119.8% of the previous day’s volume.

Breadth extremely bullish, New Highs surged, and the ten day average of Net Advancing has turned strongly bullish. The advancing volume ratio almost doubled the advancing issue ratio, the broad NYSE Composite Index outperformed the SPX and the final tick was powerful.

Total tick for the day was 322,000 and the average tick for the day was 209. There were 152 ticks greater than 600 and no ticks more extreme than -600. There were 2 ticks greater than 1000 and no ticks more extreme than -1000.


Intraday volume surged on the up moves at the open and the close. All the breadth indicators are looking strong and most troubling of all is the Absolute Breadth Indicator which suggests that we have seen our “pullback.” 


We are so overbought yet going higher! Until we won't. So until the dips are no longer bought I am not getting in front of this train!


Thursday, November 04, 2010

Wednesday Recap: A Look Inside the market

First Close above the 200wkMa, based on Stochastics we are very much overbought and need a few days down. I would love to see a 5% correction, before we grind higher.


Futures were suggesting mild strength at the open as futures were moving up a little in response to the election results and the ADP numbers - but things were fairly quiet overall. ADP reported that the private sector job market gained ground during the month of October. The report shows that private sector jobs rose by 43,000 jobs during the month, which above the consensus expectations for a gain of about 21K. September’s report was revised to show a decline of just -2,000 from -39K.

The session of the greatly anticipated QE2 announcement opened without any significant gap and proceeded to trade within a tight range for 90 minutes. But around 11:00 am sellers hit the tape and worked the tape out of the intraday range downward several points. But as is the usual, bulls gradually pushed the tape higher into the FOMC announcement. And then the whipsaw began. The long bond was hammered immediately, my position in TBT soared, commodities that were down big all morning went up and down further and up flat than down, well I  guess you know what I'm saying, it was nuts. Well they all ended up or were flat. Uranium miners (were on fire) and Crude were up before and ended up much higher by the close. and the SPX closed at the highs of the day 14 points off the lows.

The XLF which has been lagging, it was strong today and the Financials are likely to be a prime beneficiary of the Fed’s easy money policy. So this rally is likely to continue strong, even if there is a pullback.


The market got pretty much what it expected with the election and the additional Fed easing while many of the technicals are still calling for a breather and a pullback. Two of the three highly anticipated market-moving events of this week are now behind us and several of the indices are breaking out to multi-month highs. We have only seen one session of more than a 1% decline in the last two months. It can be argued that we are overdue for a two or three day pullback but we are also in an era without comparisons; the Fed policies are not just rare, they are unique. The market reaction may be as well.


For the SPX Index there were 277 Advancers/206 Decliners. On the NYSE 3,124 issues were traded with 1,721 advancing issues and 1,296 retreating issues, a ratio of 1.33 to one advancing. There were 225 new highs and 6 new lows. The five day moving average of New Highs is 188 while the five day moving average of New Lows is 13 and the ten day moving average of Net Advancing is 266. The Net Advancing data indicates a bullish trend.

The never-ending ramp continues. While New Highs are weakening, everything else in the NYSE breadth is reasonably strong and bullish.

Total tick for the day was 74,000 and the average tick for the day was 48. There were 104 ticks greater than 600 and 55 ticks more extreme than -600. There were 5 ticks greater than 1000 and 6 ticks more extreme than -1000. The tick action suggests institutional accumulation.

The intraday volume pattern was interesting as the volume was three times higher on the post-FOMC down move as it was on the up move. 


GLD is overbought as well, see the red arrows on stochastics showing the cross down. Has lead to sell-off in GLD before, I would love to buy some back down to 121, would like seeing this thing breakout and go parabolic right now. Gold is still under owned to the tune of 8:1 in comparison with DJIA.


Silver took out resistance from 7/08 and went ballistic. Again the weekly stochastics are telling me this thing needs a break but it still keeps going higher. I can't short this any more, took too much pain. (see Robert Griffiths interview on Kingnews link).

Went long TBT at stochastic crossover, has paid off finally as you can see a break in major support followed by the FED pushing up yields with QE2, people running out of bonds, see previous post how to make money from QE2. TBT breaking out of range, so you haven't missed this move.  


Long-term (Riding secular trends): Long: TBT, GLD, SLV, MOO, Uranium (basket of stocks), UNG, XLE, GDXJ and DBA

Wednesday, November 03, 2010

URZ


(URZ) Uranerz Energy Corporation, an exploration stage company, engages in the    acquisition,exploitation, and development of uranium resources. The company principally focuses on the exploration of its properties in the Powder River Basin area of Wyoming, as well as owns interests in properties in the Great Divide Basin area of Wyoming, Texas and in Saskatchewan, Canada. Uranerz Energy Corporation has a strategic alliance with Black Range Minerals Limited. As of March 31, 2009, it owned 33,972 acres in the Powder River Basin area of Wyoming; and 90,210 acres in the Arkose Mining Venture properties. The company was formerly known as Carleton Ventures Corp. and changed its name to Uranerz Energy Corporation in July 2005. Uranerz Energy Corporation was founded in 1999 and is based in Casper, Wyoming.

 URZ has a forecasted Earnings Growth Rate of 43.00%, and a PE of 15, its dirt cheap. I believe all energy stocks will benefit from QE2 and not a lot of hype on this group yet (Uranium Miners). Its severely undervalued, I picked some up a few days go, I look to add on any pullbacks be lucky to get  it back at the 200wkMa.

I also have CCJ, USU and UEC in my Uranium Play basket. I believe this will play out for the next ten years see previous posts.
Tuesday Recap: A look inside the market

Futures were pointing to a stronger open as Election Day dawned on the city of San Francisco where we greet you from tonight, the home of the 2010 Major League Baseball World Champions. As voters headed to the polls markets were looking forward to the election uncertainty being behind us and, of course, the FOMC QE2 announcement on Wednesday.

Today’s session was all in the gap; the close was right where the market was two minutes into the day. But today’s session ended the streak of six consecutive close within a two point range. We closed above the 200wk ma, and thats huge. I believe we could be headed for a rally into end of year like 1999, if the Fed doesn't disappoint. 

Looking at the Market Leaders board for this evening we see that the leaders are up across the board. Only two of the leaders are more than 4% off their 52 week highs: The Financials (XLF) and Russell Technology. As the market moves into a seasonally strong time period most of the leaders appear ready to march higher.


For the SPX Index there were 406 Advancers/82 Decliners. On the NYSE 3,127 issues were traded with 2,237 advancing issues and 801 retreating issues, a ratio of 2.79 to one advancing. There were 248 new highs and 15 new lows. The five day moving average of New Highs is 184 while the five day moving average of New Lows is 14 and the ten day moving average of Net Advancing is 380. The Net Advancing data indicates a bullish trend.

Advancing volume was higher at a ratio of 2.7 to one. The closing TRIN was 1.03 and the final tick was 881. The NYSE Composite Index gained 0.97% today while the SPX gained 0.77%.

For the NYSE, relative to the previous 30 session average, volume was -11.38% below the average. Of the last 15 sessions 7 sessions ended with volume greater than the previous rolling 30 day average volume. Of the last 30 sessions, 22 sessions ended on a positive tick, 7 of last 10. For the SPX, the day's volume was 84.1% of the average daily volume for the last year. Volume was 84.7% of the last 10 day average and 101.3% of the previous day’s volume.

Once again, data has turned back upward. Breadth was strong although the advancing volume ratio isn’t convincing. But the broad NYSE Composite Index outperformed the SPX and the final tick was strong.

Total tick for the day was 180,000 and the average tick for the day was 117. There were 71 ticks greater than 600 and 27 ticks more extreme than -600. There were no ticks greater than 1000 and 1 ticks more extreme than -1000.

The bears simply can’t get anything going. The tick data today wasn’t really powerful; but with an eight point gap upward, the bulls simply needed to hold their own today.

Troubling for the bears today also is the intraday volume pattern; we see volume increasing on the SPX up moves. The nightly breadth indicators have also turned upward, as would be expected on a day when the SPX gained almost 1%.


Sold 50% of my shorts yesterday, selling the rest this am. 40% cash. Waiting to see what the Fed does. I expect a trillion dollar package, I expect the DXY to break below 76 support and test 74. I expect Silver, Gold (miners have lagged price), Ag, XLE, other materials to out perform.  Just as a side note I saw interview with Honeywell CEO he says that Aviation (Planes) cycle is just starting. (PCP) is my favorite name here. Look for part makers, seats, and widget plays in the near future, (Alloy) ATI, and TIE come to mind as well (watchlist).


Have a great day!

Tuesday, November 02, 2010

Monday Recap: A Look Inside the Market

Stock futures were lifted by better than expected manufacturing data in China and the UK. Personal Incomes fell by -0.1% in September, which was a below the consensus expectations for an increase of +0.3%. The August reading was revised lower to +0.4% from +0.5%. Personal Spending for the month rose by +0.2%, which also below the expectations of +0.4% and the August revised reading of +0.5%. On the inflation front, the PCE Core was unchanged in September, below the consensus for +0.1%. The ISM manufacturing number was 56.9, better than the expected 54.5. Construction spending gained 0.5% while the consensus was for a drop of 0.5%. Yes, personal income dropped 0.1%, worse than the expected rise of 0.3% but he news flow today was good and the market could hold significant gains.

The market has shown a recent tendency to struggle to hold early gains and sell on good news. This is a recent shift in psychology. Maybe the market thinks if the economy is improving then the size of stimulus wont be large enough to cause inflated equity prices. We saw the bonds rally and metals fall after the release of data. Another factor holding this market down is the 200wk ma I have been talking about for a few days now. We tested it again and failed miserably.

In the SPX Index there were 230 Advancers/252 Decliners. On the NYSE 3,128 issues were traded with 1,550 advancing issues and 1,458 retreating issues, a ratio of 1.06 to one advancing. There were 211 new highs and 17 new lows. The five day moving average of New Highs is 167 while the five day moving average of New Lows is 13 and the ten day moving average of Net Advancing is 40.

Declining volume was higher at a ratio of 1.1 to one. The closing TRIN was 1.17 and the final tick was 907. The NYSE Composite Index lost -0.06% today while the SPX gained 0.09%.

For the NYSE, relative to the previous 30 session average, volume was -7.36% below the average. Of the last 15 sessions 7 sessions ended with volume greater than the previous rolling 30 day average volume. Of the last 30 sessions, 21 sessions ended on a positive tick, 6 of last 10. For the SPX, the day's volume was 89.6% of the average daily volume for the last year. Volume was 81.4% of the last 10 day average and 103% of the previous day’s volume.

SPX breadth was negative while the NYSE breadth was positive but the advancing volume ratio was negative again. The 17 New Lows is the highest since September 23rd. The final tick was strong yet the NYSE Composite Index underperformed today.

Total tick for the day was -59,000 and the average tick for the day was -38. There were 75 ticks greater than 600 and 163 ticks more extreme than -600. There was one tick greater than 1000 and 19 ticks more extreme than -1000. The tick action suggests institutional distribution.

The recent pattern of more extreme negative ticks than positive ticks continues. This strongly suggests that institutional activity is off-loading equities ahead of the FOMC announcement.

The intraday volume was light today but the pattern of volume surges on the down moves continued, most notably during the 3pm sell-off. Looking at the nightly breadth indicators, the Absolute Breadth Index continues to slide downward suggesting a topping process and the McClellan Oscillator remains in negative territory.

The election results, the Fed QE2 details, and the all-important jobs data on Friday. So this week its all about the news, if you are long you want a big stimulus package and a bad jobs report. You want the 200wk ma to be taken out with volume.


No change in my positions, except that I decreased UNG by another 25%. Have a great day everyone.

Monday, November 01, 2010

Friday Recap "A look inside the market"

Foreign markets were a drag on the futures as traders seemed to have a touch of cold feet about how much they are willing to bet on QE2. The government’s advance report on the nation’s second quarter GDP (which really only includes the first two months of data) shows the economy grew at an annualized rate of just 2.0% in the quarter, which is above the consensus expectations for a growth rate of 1.9. Looking at the consumer activity, the Personal Consumption component of the report came in above expectations with a gain of 2.6% vs. 1.9%.

The last session of the week began with a small gap downward followed by several waves within a tight four point range, putting the high of the day on the chart at 10:26 and the low at 11:48. This session was similar to last Friday when the index traded in a very tight range with low volume.

For day traders, the best thing about days such as this is that they do eventually end. It is just six and half hours like every other session; but it really seems like much longer. We understand the reference to “smart money” better after days like this; they were smart enough to take Friday off.

Looking at our Market Leader’s board, we again see mixed results from Friday’s inaction. A few weeks ago, Technology was lagging alongside of the Financials (XLF); but recently the Financials have stood alone. One item to take note of is that the 52 week lows for the SOX and Russell 2000 slide off the board next week as the calendar moves on.


The SPX gained 0.18 points during the week. The four week RSI of the four indices (SPX, Dow, NASDAQ, and Russell 200) is 87. Pullbacks often occur as this RSI reaches 80.

For the SPX, there were 240 components advancing and 246 declining. Total tick for the week was 154,000. The number of components with their 5 DMA above their 20 DMA decreased during the week from a ratio of 3.65 to one to 2.1 to one.

On the NYSE, the advance/decline line increased slightly during the week but the 10 DMA of Net Advancing dropped from 214 to 133.

Friday ended the nine week streak of consecutive higher Friday closes for the SPX and also ended the ten week streak of consecutive weekly closes on a positive final tick.

The week painted a perfect doji on the weekly chart but even rarer was that we saw five consecutive dojis painted on the daily chart as well. All five sessions closed within a three point range and the average intraday range was 10.22 points.


For the SPX Index there were 292 Advancers/191 Decliners. On the NYSE 3,099 issues were traded with 1,805 advancing issues and 1,189 retreating issues, a ratio of 1.52 to one advancing. There were 147 new highs and 11 new lows. The five day moving average of New Highs is 163 while the five day moving average of New Lows is 12 and the ten day moving average of Net Advancing is 133.

Advancing volume was higher at a ratio of 1.25 to one. The closing TRIN was 1.21 and the final tick was -97. The NYSE Composite Index gained 0.11% today while the SPX lost -0.04%.

For the NYSE, relative to the previous 30 session average, volume was .05% above the average. Of the last 15 sessions 7 sessions ended with volume greater than the previous rolling 30 day average volume. Of the last 30 sessions, 21 sessions ended on a positive tick, 6 of last 10. For the SPX, the day's volume was 76.6% of the average daily volume for the last year. Volume was 74.2% of the last 10 day average and 83.8% of the previous day’s volume.

Breadth was strong Friday but the advancing volume ratio was weaker than the advancing issues. Volume was anemic and intraday range was tiny, within a fraction of the smallest this year. But the news from the NYSE statistics is that the ten week streak of consecutive weekly closes on a positive tick ends. The last Friday which closed on a negative tick was August 13th and the SPX was below 1080.

Total tick for the day was 140,000 and the average tick for the day was 91. There were 57 ticks greater than 600 and 13 ticks more extreme than -600. There were 3 ticks greater than 1000 and no ticks more extreme than -1000.

The intraday volume pattern is once again distinctive. Volume spiked on every little downward move of the index and volume dropped off during each little upward move.

Looking at the nightly breadth indicators, we are continuing to see weakness within the indicators. The McClellan Oscillator remains in negative ground, the Summation Index continues to decline, the advance/declines are weakening, and the Absolute Breadth Index is suggesting a market top.


The biggest gainer was the VIX, with a big move up and no move in the market. Fitting during the Halloween week, SCARY! So let the fun begin this week especially late Tuesday or Wednesday.