 |
| DOW (white), SPX (yellow), NAZ (blue) |
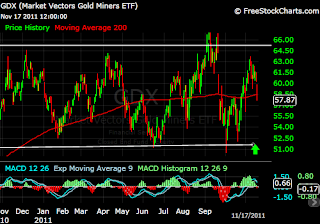
I hear a lot of talk on CNBS about how the precious metals miners will under-perform other stocks because of this or that reason. And while the actual price of gold and silver have gone up much more than any type of index you can clearly see by this 5 year monthly that the GDX which is a basket of large cap mining stocks has been a clear winner. Unless you ere in all cash and bought at the bottom in late Feb or 09 you'd have made no money in the Dow or SPX (tech is another story).
But in investing is much like rehabilitation, "we don't care where you have been or what you did in the past, we care where are you going". I am going to put the dollar chart next to show you the correlation of stock prices with lower dollar price. And as you can see we are in a sideways consolidation the longer this chart stays sideways, which ever trend line is broken we are going to have a powerful multi-month move. This is what you live for does not matter if its up or down. You play the trend.

The dollar has been treated as the safe place to park while the eurozone clears its mess, but that garbage heap is so huge it will take an act of God to clear. I don't think they will find a solution in europe because its hard for them to come together, no unity. So you will see these big up days and big down days and if yo are a trader yo love that because you sell on the big up days and you buy on the big down days, never holding (this isn't a buy and hold market and it hasn't been since August).
The SPX is barely hanging on above the recent break out over 1220, it tested the break out support line and if that broke we'd probably head to 1100. The MACD remains over bought and it seems to be rounding down. This is a very important week for the SPX, it needs to take out the recent high as the ADX or we will surely break support.
This is 52 week ADX, trendline. You can see the left side of the chart shows a powerful uptrend that started in 09, and for most of 2011 we have been going sideways. This recent rally in stocks has pushed the ADX to a critical point. We either need to punch through this line or head back to the lower end of the sideways range and that my friends will begin the push towards 1100 on the SPX.
On to the PM's. Silver is trading right at its 50dma, the bull flag has now turned into a sideways channel and that's not good. A breakout above the upper band would be helpful but silver is difficult to chart due to its lack of liquidity and all the shenanigans at the CME. The COT's are favorable and that hasn't seemed to have mattered. Money supply (MI) is up 30% in the last couple of months and that does not seem to matter. If we get a massive program of QE out of Europe this will take off like a rocket if we don't, sideways to down action is expected. Again trading isnt a game of hope or "I wish this or that". Play the music sheet in front of you!
Gold looks great, It survived a big sell off last week got support at the upper band of the recent break out and is poised to go higher. Again all the same things that apply to silver apply to gold but gold is more difficult to manipulate.
I will have a follow up to the watchlist I put up last week later.


