Friday, April 08, 2011

US housing system a bad model, IMF says

  • United States as a poster child for bad housing policies
  • Analysing mortgage finance systems in 33 countries, the IMF painted a dysfunctional US model.
  • needs to be reformed," said the IMF (You think?)
  • "The United States generously subsidises homebuying, but poorly regulates lenders" (Nah, really?)
Guys, where were you a few years ago? Thanks for this valuable message, whats funny is that nothings changed so maybe they are just in time, LOL.

This comedy break brought to you by the IMF 

for more laughs: Link

Canada Weaning Itself From US Trade

"Even you little brother"?

The Bank of Canada has repeatedly urged exporters not to rely on the currency weakening or a rebound in U.S. spending, but to seek new markets and invest in new technology to remain competitive.


Canada relied less on the United States last year as the main buyer of its exports and sharply boosted its trade with China, Statistics Canada data revealed Thursday


The United States still accounted for 74.9% of Canada’s exports in 2010, but that was down from 87% in 2001.


Article

Strathmore: STHJF

Sell-off courtesy of Japan's Earthquake, and fall in U Prices, they are stabilizing at the moment.  
Best place for mining uranium in the US is Wyoming and New Mexico, because that's where the majority of uranium has been produced in the past and where current resources are likely to be developed. 
  
Reasons to like Strathmore
  • Their Roca Honda, New Mexico property, is arguably the best undeveloped underground uranium deposit in the United States. 
  • They are proceeding with mine permitting at Roca Honda and in the Gas Hills of Wyoming, where they have the commanding land position for conventional open pit uranium development.
  •  In addition they have another eight development projects. They had 10 a few months ago and they've monetized two of those. 

  • The company has every intention of monetizing its other development properties in New Mexico and Wyoming. 
  • Strathmore has $29 million of working capital and is absolutely the most undervalued uranium developer on any North American exchange. 
  • With a market capitalization around $60 million, $29 million working capital and 125 million pounds of uranium resources, I think Strathmore is a no-brainer at $.85. 
  • Short-term target 1.6

More of the same BS from Fed

  • FISHER SAYS FED NEAR `TIPPING POINT,' MUST `NORMALIZE' POLICY

  • FISHER SAYS U.S. NEEDS TO REVERSE ITS BUDGETARY DEATH SPIRAL'

  • FISHER SAYS MAYBE FED SHOULD CURTAIL QUANTITATIVE EASING PLAN *FED'S FISHER SAYS 

  • INFLATIONARY IMPULSES' INCREASING WORLDWIDE *FISHER SEES FED'S DUTY AS NOT TO MONETIZE' U.S. DEBT

Everything he says is the absolute truth!

But no one really cares, the fix is in.
Its going to fall on deaf ears.
Ben's standing orders are to keep the print shop in operation.

Wanna know when there is some meat to what they say (Game Changer), just watch the charts. See what the UUP did when they spoke, see how metals reacted. Nothing Happened! NOTHING


GOLD Did I call this move or what

Pointed this out couple weeks ago. Nice to be right once in a while! Take profits around 1520-1540

US DOLLAR INDEX: OUCH!!

USD ETF, well below the 08 financial crisis. If any of you still think that what the FED is doing is good for this country, PLEASE TAKE YOUR HEAD OUT OF THE SAND, WAKE UP. Protect yourself. Metals, other commodities. Things are going to get real expensive on the grocers shelves. STOCK UP. You don't believe me listen guys like David Einhorn and Peter Schiff, the guys who called the 08 meltdown. People were laughing at them back then. "We won't get fooled again". 

Marc Faber Interview: Inflation Money Printing Gold Silver

The Federal Reserve's money-printing policies continue to make gold an attractive investment even though it has hit a succession of new highs recently, Marc Faber, author of the Gloom Boom & Doom report, told CNBC.
"Dr. Doom" as he is often referred to, rejected the notion that gold is in a bubble even as it begins to approach $1,500 an ounce.

  • He related a story from a conference he attended this week where he asked the investment professionals in attendance if any had more than 5 percent of their personal assets in gold. No one raised a hand. 


  • "If it were a bubble a lot of people would have gold. The whole world would be trading gold 24 hours a day," he said. "But I don't think it's really a bubble. I think gold is maybe cheaper today than it was in 1999, when it was $252.


  • What makes gold such an attractive investment is due in part to the Fed's move to keep the US dollar cheap as a way to boost asset prices and stimulate a recovery.


  • Investments in hard assets will be good buys in the future as Chairman Ben Bernanke and the rest of the Fed continue the liquidity-friendly policies, Faber said.


  • This is bad news for consumers, who will pay more for food, energy and a broad spectrum of other goods as inflation accelerates.


  • Even if the Fed enacts incremental interest rate increases. That's because small raises won't be able to keep pace with inflation and thus won't slow down the hike in prices in real dollar terms.


Bullish Divergence? S&P 500 Recap

Intra-day: Things began calmly enough with a very small opening gap lower. But the S&P quickly rebounded to put the high of the day on the chart just after 10:00 am. The next forty-five minutes were sharply lower as the index threw off twelve points. But bulls were not giving up easily. The next forty-five minutes the index bounced eight points before sellers resumed their work to quickly take the index back to test the lows before yet another ten point bounce. Sellers took the index down about six points early in the afternoon before trading sideways until about 2:30 pm. The final ninety minutes saw the S&P trade upward a few points to close in the middle of the intraday range while the Russell 2000 small caps traded sideways with a slight downward bias. When those indices move in opposite directions, the small caps often lead.
Breadth: While breadth was negative today, declining volume was lighter in declining issues and stronger in advancing issues; this can be seen as a positive for the market. Bears should be alarmed that the five day low on the S&P also managed the lowest number of New Lows; this is a bullish divergence.
Volume: was lighter than Wednesday. Looking at the intraday volume pattern, we see a huge spike in volume with the midmorning sell off and then we see volume dropping with the market bounce early afternoon. This pattern isn't bullish at all. Looking at the Breadth Indicators we continue to see a mix but today is looking more bearish but nothing conclusive as of yet.


A/D: For the S&P Index there were 153 components advancing and 322 components declining. On the NYSE 3,135 issues were traded with 1,137 advancing issues and 1,901 retreating issues, a ratio of 1.67 to one declining. There were 160 new highs and 5 new lows. 


New Highs: The five day moving average of New Highs is 279 while the five day moving average of New Lows is 11 and the ten day moving average of Net Advancing is 483. The Net Advancing data indicates a bullish trend.44% of the S&P are above their five day moving average, 62.6% are above their 10 day average, 82.2% are above their 20 day moving average, 72% are above their 50 day moving average, and 87.6% are above their 200 day moving average.


Sector Performance:


Sectors stronger than the S&P for Thursday:
- Energy -- Outperformed  by +15%.
- Technology -- Outperformed by +12%.
- Consumer Staples -- Outperformed by +29%.

Sectors weaker than the S&P for Thursday:
- Basic Materials -- Underperformed  by -11%.
- Financials -- Underperformed  by -32%.
- Industrials -- Underperformed  by -34%.
- Utilities -- Underperformed  by -24%.
- Health Care -- Underperformed  by -2%.
- Consumer Discretionary -- Underperformed  by -25%.


Support/Resistance
S: 1325
R:1340


OUTLOOK:
Short-term: Bull within a bear market. For how long? Just watch the 150dma. 
Secular trend: Secular Bear that started in 2000 continues.

SILVER over 40 bucks

I have no idea how the witch and her coven have let this happen. I am shocked we are over 40 bucks this morning. Lets see how long this lasts.

Thursday, April 07, 2011

Bears Give Up: Fighting the FED Doesn't Pay

The number of investors with a bearish outlook plunged by more than a third in one week according to a widely followed investor survey released Wednesday, the largest amount of bears to throw in the towel in this poll since 2003.

The survey ending April 5 came as the indomitable Dow Jones Industrial Average (Dow Jones Global Indexes: .DJIA) touched its highest intraday point since the two-year bull market began.

Middle East turmoil, an Irish bailout, fears of a municipal bond crisis, a nuclear disaster in Japan and an impending end to the Federal Reserve's quantitative easing has failed to keep the market down this year. And the bears are simply done fighting the tape.

Bears collapsed to just 15.7 percent of those surveyed from a 23.1 percent part of the pie just one week ago, according to the weekly survey of financial newsletter writers by research firm Investors Intelligence. That 32 percent drop is the biggest in a single week since a 37 percent switchover in 2003, according to Bespoke Investment Group's analysis of the II data.

"That action in the face of still ongoing negative news from around the world was certainly impressive and it reinforced the perception that US stocks were still offering value," wrote Mike Burke and John Gray of Investors Intelligence, in the report. "A week ago we noted the speed of the (equity) move from the March lows didn't allow for much reaction from the advisors. However, another week of markets moving higher was clearly enough for many newsletter editors to make a shift."


Link to full article

Japan Hit By Another Earthquake

CNBC Reporting 7.4

Tsunami warnings are also being reported


VIX spikes 6%

Uranium Miners

Even before the earthquake in Japan, it looked as if uranium prices in a correction mode, Ux mining stocks were following as they usually do (Please note: There is no formal exchange (Like COMEX) for Uranium trading). The Fukushima disaster just intensified and magnified the sell-off. We saw spot prices crater to a low of $49/lb. on March 16 before recovering to $60/lb. on March 21. The political and public resistance to nuclear energy in the short and long term is anybody's guess at this point.

Globally, this was the third nuclear plant incident in more than 30 years. The first was Three Mile Island. While nothing of real consequence happened, it did change the perception of nuclear safety. The second incident was Chernobyl where the reactor melted down, resulting in serious environmental and health impacts. That reactor was an obsolete and inadequate design with no containment vessel and was never used in the West. Although Japan's Fukushima plant was using some older technology and we still don't know what the full damage will be, it will not be anything near the Chernobyl disaster.

When this disaster happened recently we saw the uranium stocks sell off and Nat Gas, Solar and Wind stocks fly upwards, oil stocks have been on fire. We know the economy can't handle 150 dollar barrel oil, and many are predicting another recession if that were the case, consumers are already getting clobbered by inflation, whether the government admits it or not.

Solar cannot provide base-load electricity because of night and wind cannot because it does not blow constantly at the same velocity 24 hours a day, 7 days a week for 365 days a year. We don't have the natural gas transportation, storage and filling infrastructure to convert electrical plants or vehicles quickly. Then there is politics, we also have the Eco-fascists who preach "clean and green," but then launch lawsuits to stop solar plants in the Mojave Desert and offshore wind farms on the East Coast. What do the NIMBY's (not in my backyard) want? Where will we get the energy to heat our homes, etc?

Coal has been the big beneficiary of this disaster: with supply disruptions causing rapid rises in price, but it is our dirtiest form of energy and a major pollutant worldwide.

So where do we go from here. Volatility will be the name of the game in this space for quite sometime. But the fundamentals are in support of this group even if there are no more new plants to some on line and that is highly unlikely. People will forget as they always do!.

Did did you know that even if all under-construction and planned nuclear facilities are suspended, not enough uranium is being mined currently to supply current demand.

Currently there is a shortage of uranium. We haven't mined enough uranium for 25 years and our current mine supply deficit is 30% of total yearly demand. What the world has been relying on for supply is using uranium from old Russian warheads and sovereign uranium stores that ware said to run out by 2013.

In my opinion, we desperately need a viable domestic uranium industry as we strive to reach energy independence in the U.S. I trust that the American people and its politicians and policymakers will continue to ensure that all forms of energy, including nuclear power, play a part in this mix.

There are a number to play this SECULAR BULL, right now sector is beaten down (Volatile), and ripe for the picking but you have to have price discipline set stops, the small stocks are like bottle rockets, so this group is not for the faint of heart.
ETF: URA, NLR

Big Kahuna: CCJ 

Little Guys: URZ, UEC, DNN

As always do your own home work and pick good entry points.

Gold and Silver Update


 Both Gold and Silver Closed up a bit yesterday, Gold closed up 5 dollars to $1457.70 Silver rose 20 cents to $39.38. The open interest in Gold was up a huge 20,941 contracts and in Silver it rose again by 1745 contracts. These are HUGE numbers.
As you have read in my previous posts, I believe Gold breakout leads to 1520-1540 in the short term (Resistance was at 1440, is now SUPPORT).

For Silver we have resistance at 40 and major support at 38.20.


LONG: PM SILVER, buying any dip! 
Trading around: AGQ (40% position right now) time to get defensive. It could drop 30 points very quickly, will re-enter around that 38.2 spot level

ECB Raises Rates By 0.25%

FRANKFURT (Reuters) - The European Central Bank raised interest rates by 25 basis points to 1.25 percent on Thursday, announcing its first hike since July 2008 to counter firming inflation pressures in the 17-country euro zone.

The euro was steady after the decision, which ECB policymakers had flagged heavily in advance. All but four of 80 economists polled by Reuters last week expected a 25 basis point rise.

The increase in the ECB's benchmark refinancing rate marks a gentle exit from the central bank's policy response to the global financial crisis. It had held the refi rate at a record low 1.0 percent since May 2009.

The ECB also raised its deposit rate by 25 basis points to 0.50 percent, and increased its marginal lending rate by the same amount to 2.0 percent.


Reuters


Portuguese Bailout Could Be North Of 129 Billion Euro
WSJ

S&P 500 Recap, a look ahead

Good morning, S&P futures are up slightly this morning even as Portugal is in big trouble of going under. The ECB is supposed to do a rate hike cause they see the inflation Bernanke doesn't. Just look at the chart of the euro versus the dollar and you'll see who is the smarter of the two. More than three-quarters of the nation's 372 largest metro areas reported lower unemployment rates in February than the previous month, the Labor Department said Wednesday. That's the most to report a decline since September.

Yesterday gains in overseas markets (including the Chi-CONS, they shook off the rate hike). The Japanese said that they have been able to stop the flow of radioactive water that had been pouring into the ocean. REALLY!

So heading into the morning we had buying pressure in the futures, the session opened with a gap upward and went higher for a bit. But the high of the day was on the chart within the first fifteen minutes and we began to see today the pattern that we have now seen six sessions in a row: An early day high followed by selling. But this day ended differently as we had buyers come in and we finished up in the middle of the trading range for the day.


The breadth data is looking bullish as advancing volume was slightly higher than advancing issues. New Highs were strong but many of those New Highs closed down more than 1% from the highs so tomorrow may be interesting.
Volume was slightly greater than Tuesday's. Looking at the intraday volume pattern we see a spike of volume with the morning down move as well as a larger spike of volume with the late afternoon rally. Looking at the Breadth Indicators we continue to see mixed indicators suggesting choppy trading for at least another session or two.
58.6% of the SPX are above their five day moving average, 74.2% are above their 10 day average, 86.4% are above their 20 day moving average, 74.6% are above their 50 day moving average, and 88.2% are above their 200 day moving average.


Financials, Technology Consumer Staples Utilities Outperformed the S&P, If you are looking to go long here is a list of good RS stocks in this market: These are RENTALS not KEEPERS

ABT, ANF, AES, URBN, AFL, A, APD, ARG, AKS, AA, ATI, AGN, MO, AEE, AEP, AXP, AMGN, ADM, ADP, AVY, AVP, BLL, BAC, BAX, BDX, BBBY, BMS, BIIB, BMC, BXP, CBG,  CHRW, CVX, CME, CB, XEL, CINF, CTAS, CSCO, KO, CCE, CL, CMA, CPWR, ED, CEG, SAI, COST, CVS, DNR, DV, DO, RRD, DOW, DTE, DUK, DNB, DD, ETFC, EMN, ECL, EIX, ERTS, EQT, FAST, F, FRX, FO, FCX, GME, GPC, GENZ, GT, GWW, HAR, HRS, HIG, HAS, HNZ, HSY, IBM, IGT, ISRG, IRM, JEC, JPM, CLF, KMB, KSS,  LH, LLY, LTD, M, MI, MA, MAT, MJN, MCD, MWV, MDP, MSFT, MOLX, TAP, MWW, MCO, MS, MUR, MYL, NBR, NDAQ, NEM, GAS, NKE, JWN, NU, NTRS, NYX, PLL, PH, PDCO, PBCT, PEP, PCG, PM, PNW, PGN, PGR, PRU, DGX, RSH, RRC, RSG, RHI, R, SNDK, SLE, SCG, SCHW, SEE, SRE, SIAL, SNA, SO, STJ, SPLS, STT, SRCL, SUN, STI, SYY, TGT, TE, TLAB, TER, TSO, TXT, TIF, TWX, TJX, TSS, UTX, VLO, VAR, VRSN, VNO, VMC, WMT, WPO, WM, WPI, , AMZN.


Wednesday, April 06, 2011

Another Bubble The Fed Is Helping To Create


Bernanke Cash Drives Junk Bond Frenzy as JPMorgan Faces Record Competition
By Lisa Abramowicz - Apr 1, 2011 12:00 AM ET


Federal Reserve Chairman "The Ben S. Bernank".

An unprecedented number of investment banks are vying to underwrite a record amount of junk bonds as Federal Reserve Chairman Ben S. Bernanke succeeds in driving cash to the neediest U.S. borrowers.
JPMorgan Chase & Co. (JPM) led 42 firms helping companies to issue speculative-grade debt this year, up from 39 in the first quarter of last year and 14 in the first three months of 2009, according to data compiled by Bloomberg. High-yield bond sales have reached about $88.3 billion in 2011, on pace to exceed last year’s record $287.6 billion, the data show.

The Fed is in the midst of buying $600 billion of Treasuries in an attempt to pump cash into the financial system and encourage investors to wade into riskier debt. The strategy is allowing high-risk borrowers to cut interest expense, extend maturities and avoid missing debt payments. Moody’s Investors Service says the default rate in the U.S. tumbled to 3 percent in February from a peak of 14.7 percent in November 2009.

“They’re all out there and they’re all pitching hard,” said Douglas Coltharp, the chief financial officer at Birmingham, Alabama-based HealthSouth Corp. (HLS), the nation’s largest provider of inpatient services. “Banks go where the activity and the opportunity is.”

HealthSouth has issued about $650 million of bonds with B ratings since the end of September, compared with about $915 million of notes in the previous seven years, Bloomberg data show. Debt rated below Baa3 by Moody’s and lower than BBB- at Standard & Poor’s is considered speculative grade, or junk.
Click here for original source

Bizarre S&P Behavior

JUST WHEN I GET STOPPED OUT!

INTRA-DAY 5 Min CHART

SILVER REVERSES ON CUE


IMF economists see dire future for US taxpayers

Americans will need to pay much heavier taxes and accept less from public healthcare to put state finances on a sustainable track, according to an IMF study published on Monday.

"The United States is facing an untenable fiscal situation due to the combination of high fiscal deficits, an aging population and rapid growth in government-provided healthcare benefits," three International Monetary Fund economists said in a report.

The economists analysed the large US public deficit and debt levels and their relation to the demands aging Baby Boomers will place on the government's Medicare and Medicaid healthcare programs, while the birth rate lags at a record low.
Advertisement: Story continues below

In "An Analysis of US Fiscal and Generational Imbalances: Who Will Pay and How?," they said the problem lies in government entitlement programs and especially healthcare -- among the most expensive in the world-- that face rapidly rising costs in coming years.

Under their "baseline scenario," Americans need to pay more taxes and the government must cut spending on Baby Boomers -- those Americans between about 45 and 65 -- and their immediate heirs.

Such steps "would go a long way in returning the United States to a fiscally sustainable path."

Fully eliminating current deficits and the long-term shortfalls on social plan commitments for the current generation "would require all taxes to go up and all transfers to be cut immediately and permanently by 35 per cent," they said.

The US recovery is little more than an economic 'sugar-rush'

This is a great article, the gentleman really hits the nail on the head. Don't be fooled by the fools you listen to on TV. They are selling Ad dollars, thats it. 

Fine, make money in the stock market but keep one foot out the door, this ain't 1980. We aren't in a new bull market this is a bull inside a Secular Bear. It will end badly, I can't tell you exactly when, but you'll feel it when gold is at 2000 and Silver at 120. 

The US recovery is little more than an economic 'sugar-rush' 
Liam Halligan

Guess what! America is on the mend. That’s right, the world’s biggest economy is now forging ahead, escaping its sub-prime malaise.

Strengthening jobs data last week show the US has reached a “turning point”. On Wall Street, the Dow Jones share index just hit its highest level since June 2008.


As America cranks up, forecasts of higher energy use in the West are boosting oil prices. Brent crude extended gains to over $119 a barrel on Friday, a 32-month high. In London, the FTSE-100 joined the party, closing above 6,000 points for the first time since early March.
Equity markets are interpreting a slew of recent US data as “evidence” the global economy is on the road to a full recovery. Private employers hired 230,000 people in the States last month, building on the 240,000 new jobs created the month before. Forget America’s “jobless recovery”. Unemployment is now at a two-year low of 8.8pc, down from 8.9pc in February and 10.2pc in early 2010.
Survey results suggest industrial activity is leading the charge. The ISM manufacturing index has bounced back from last summer’s slump and is now at levels not seen since 2004. The index measuring hiring at US manufacturing firms is at its highest level in three decades.

U.S. to reach debt limit by May 16: Geithner

geithner cartoons, geithner cartoon, geithner picture, geithner pictures, geithner image, geithner images, geithner illustration, geithner illustrations


WASHINGTON - The United States will hit the legal limit on its ability to borrow no later than May 16, Treasury Secretary Timothy Geithner said on Monday, ramping up the pressure on Congress to act to avoid a default.
Previously, the Treasury had warned that the country could hit the US$14.294-trillion statutory debt limit between April 15 and May 31.
In a letter to U.S. Senate Majority Leader Harry Reid, Mr. Geithner said that while the projections could change, the Obama administration does not believe they could change in a way that would give Congress more time to raise the debt ceiling.
Mr. Geithner's warning comes as Republican and Democratic lawmakers struggle to complete a spending package that would keep the government operating beyond Friday. Republicans want to use that bill to cut spending more deeply than Democrats.
If the debt ceiling is not increased by May 16, Mr. Geithner said the Treasury has authority to take certain extraordinary measures to temporarily postpone the date the United States would default on its obligations.
However, those actions would be exhausted after about eight weeks and there would be "no headroom" to borrow within the limit after July 8, he said.

Fed Help Kept Banks Afloat, Until It Didn’t

WASHINGTON — During the frenetic months of the financial crisis, the Federal Reserve stretched the limits of its legal authority by lending money to more than 100 banks that subsequently failed.

Multimedia


Borrowing as They Went Down
The loans through the so-called discount window transformed a little-used program for banks that run low on cash into a source of long-term financing for troubled institutions, some of which borrowed regularly from the Fed for more than a year.

The central bank took little risk in making the loans, protecting itself by demanding large amounts of collateral. But propping up failing banks can increase the eventual cleanup costs for the Federal Deposit Insurance Corporation because it keeps struggling banks afloat, allowing them to get even deeper in debt. It also can clog the arteries of the financial system, tying up money in banks that are no longer making new loans.

County Bank, the largest bank in Merced County, California, took a $4.8 million loan from the discount window in March 2008 after announcing the first annual loss in its 30-year history, news that prompted depositors to withdraw $52 million.


LINK

Metals Update

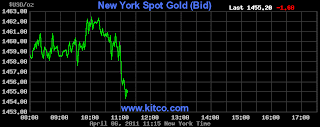
Gold closed today in record territory rising by $21 to $1453.10. Silver rose as well to $39.18 and within a stone throw of my $40.00 target,  for April 1st 2011 (I was a little off). 

Yesterday the banksters tried to beat down Gold, it was raided heavily twice and each time it bounced up hard and finally shot through resistance (see Inverse HNS post)

Silver rose in the identical manner to close at its 31 year old record high of $39.18.

The total gold comex OI fell by 5122 contracts to 488,018 from Monday's level of 493,137. Short sellers are running for the hills. In Silver OI rose 1814 contracts to 141,268 from 139,454.

I would really be careful here around the 40 dollar mark in silver. You have JPM's witch Blythe and her dogs lurking to pound the metals before we head to 44 by Mid-May. 

Also for all those who are following the AGQ trade, its now 8 dollars above my target. Took half off this am. 


Can't Short This Market

Good morning, I'm a little late today but since the market just goes up everyday, really is there any need for TA (thats Technical Analysis not the other thing). 


On Tuesday we go a real big deal announced between Texas Instruments and National Semiconductor, there was a rate hike by the CHI-Coms and Moody's downgrade of Portugal's debt (wow way to go Moody's) had the futures on the defensive in the early going. In addition, the upcoming rebalancing of the Nasdaq-100 index was putting pressure Apple, which was also dragging on the indices. There was no economic data to review before the open.

The volume was heavier than Monday's but there really was no pattern discernible to the intraday volume pattern. Looking at the Breadth Indicators we find a mixed set of indicators, still suggesting more sideways choppy trade for at least a
nother session or two.

Breadth was just barely positive but advancing volume was stronger. Once again we see the NYSE Composite outperform the S&P , although not by much. The rally looks tired (but right now the old TA is just BS, we just keep going up).
65.4% of the S&P are above their five day moving average, 79.3% are above their 10 day average, 84.4% are above their 20 day moving average, 72.8% are above their 50 day moving average, and 87.2% are above their 200 day moving average.


Basic Materials outperformed by over 100%, Energy by +39%. Consumer Staples, by +11%. Consumer Discretionary by +42%. I got stopped out of my BGZ (while I was writing), another 3% loss. I GIVE UP SHORTING. 


Taking Some Profits In Silver

I had a target of 40 by the end of March, well I was off by a couple of days. We are over 39.5 and I'm going to take some Fiat off the table.

Live 24 hours silver chart [ Kitco Inc. ]


Live New York Silver Chart [ Kitco Inc. ]

The "Real" Real-Estate Situation


Although the Government would like you to believe that that there is job growth real unemployment is at 16%. They want you do believe that the Feds money printing is going to fix the economy and housing but that isn't what the numbers show. What is more bizarre to me anyway is that the investment community I see on CNBC/Bloomberg (except one or two guests a month) don't really do their homework and they just spout government propaganda. I was shocked by the recent exchange between the CNBC "Fast Money Crew" and Peter Schiff, I expected more. These were the same type of folks laughing at Schiff in 2006 when he called the the financial crisis.  


Right now real estate professionals and Wall Street will figure out a way to spin housing data in a positive manner, but the housing market still has a long to way to fall in order to correct from the massive bubble inflated by Greenspan and the related lending fraud enabled by the government.  While Govt/industry inventory shows relatively flat growth projections, the shadow inventory of foreclosures, impending foreclosures, unreported Bank REO's and potential existing homeowners who would like to sell but want to "wait for the market to come back a bit" has created a massive glut of inventory that it is going take substantially lower prices or a much stronger economy in order to restore supply/demand stability.  Of course, the Government and Wall Street would like you to believe that the shadow inventory is not really there.
Number Foreclosures


As per the National Association of Realtors' report last month, existing home sales plunged 9.6% (annualized) in February and the number was substantially below the Wall Street-Einstein consensus estimate.  Prices declined 5.2% to their lowest level in nearly nine years.  That's a big price drop and contrary to the views of the analysts, lower prices are not stimulating sales.  Here is recent report from Bloomberg news.  

As most have seen by now, new home sales absolutely collapsed by 16.9% in February to a record low.  I just want to point out how lame our financial media is by showing you the Bloomberg news headline BEFORE the news hit - Bloomberg was anticipating a strong number :"Sales of New Homes in U.S. Probably Climbed in February" 

I wanted to post that in order to show how important it is to do your own homework in order to get closer to the truth.  The financial media in general is a complete failure at this. They helped propagate the lies (unintentionally i'm sure) but aren't they supposed to do homework before they report, isn't that something they teach in Journalism, fact verification?

Here's the details to recent new home sales report:  New-home sales reach record low; Feb. median new-home price down 13.9% to $202.1K; Feb. median new-home price drop biggest on record; Northeast new-home sales fall 57% on month; Every region but the West saw record lows. Link

"Pending home sales" index, which is compiled and released by the National Association of Realtors.  By their measure, pending home sales (i.e. contracts to purchase existing homes) increased by 2.1% in February, although they are down nearly 10% from Feb 2010.  


While I will say that it is likely that, with banks looking to unload foreclosed inventory to make room for even more foreclosures, there was a marginal increase from January's depressed levels, this data is extraordinarily inconsistent with the purchase mortgage application data released on a weekly basis by the Mortgage Bankers or America Association, which ha been plummeting almost every week, but improved a bit in March.  


If you are looking for a reason to question the reliability of the NAR's data, besides applications for mortgages to purchase a home, then take a look at this remark by Lawrence Yun, the chief economist for the NAR and perpetual cheerleader/data-spinner:  “We may not see notable gains in existing-home sales in the near term, but they’re expected to rise 5 to 10 percent this year with the economic recovery, job creation and excellent affordability.” 
Wasn't supposed to happen Ben!


Home Prices (Bloomberg:LINK)

And then there was this Case-Shiller monthly 20-city home price index, which showed an across-the-board decline in home values in January, except of course in Washington, DC.
This is terrible news because the Case-S index is skewed away from the price-effect of foreclosures, and thus understates the true decline in home prices (Property taxes going up) going on out there.  This is horrible news not only for current home owners, but also for the banks and investors who are invested in mortgage paper, which is losing its "equity" cushion on a steady basis.

Anyone think QE2 will be it for the time being?  Better think again because with collateral value shrinking in this country and the economy headed back into the tank, if the Fed were to stop printing money it would likely lead to economic catastrophe, not to mention the fact that the Government would lose its primary source of funding. 

Tuesday, April 05, 2011

Gold Up $21: Inverse HNS Breakout

SEE PREVIOUS POST INVERSE HNS TARGET  1520-1540 (2-3 months)

Surreal Video looking back at 2006: Spooky!

This is the same kind of denial I hear today about the state our economy.

VIDEO (Peter Schiff vs. Financial Guru's)

More Video's 

Don't Get Fooled Again! : The Inside Job

The Inside Job (watch free): I didn't want to watch this movie for quite some time maybe had some sort of Post-Traumatic Syndrome like issue with it. Re-living those days, the loss of all that money (ouch). That was a bad time for me and for most Americans (as well as people all over the world), most of us lost 50% for our net worth, countless jobs were lost, world economy went into a depression (why mince words).

Whether you had your head in the sand and didn't know what happened, or you're just like me (PTSD); muster up the courage, watch this. WHY???

Because it's going to happen again! I know you like most are watching the S&P go up for the last couple of years and feeling pretty good about your portfolio's, I know I was, around October 2007. I was completely unprepared, a naive bull, the government had my back, right? Turned out they were clueless too! Only a hand full of people (Peter Schiff, David Einhorn and Nouriel Roubini)  knew this was coming and the same is true now.


Right now, we are living in LaLa Land if you are in stocks. The Fed's QE program has effectively put a floor under stocks. The low interest or free money has to be put to work and thats helping equities, pullbacks are viewed as buying opportunities. And what about bonds, should they not be going up, as FED  is buying bonds. Why were bond prices hammered in the last few months. Why are our foreign creditors dumping our debt (mainly the Chinese) and why did PIMCO dump their stash. 

Not trying to scare you, but prepare you for the coming debt crisis (I posted this 10/25/10), but don't take my word for it see what PIMCO's Bill Gross has to say about it, PIMCO sold out in March 2011. 


MY HEART GOES OUT TO: Retirees, and working class people


These people on fixed income they truly are in a horrible situation. Most of these people played by the rules, worked hard and saved all their lives, invested conservatively, they're getting whacked by inflation and the debasement of the dollar. They are getting hit on any recent fixed income purchases, because yields are so low. And any longer-dated instruments are going to get clobbered if and when bond market sells off further (even if they hold to maturity), the real rates they'll earn at maturity are likely negative considering the current inflation rate.