Friday, January 14, 2011

NEWS


New Hit to Strapped States 
Borrowing Costs Up as Bond Flops; Refinancing Crunch Nears 

By MICHAEL CORKERY And IANTHE JEANNE DUGAN
With the market for municipal bonds tumbling, cities, hospitals, schools and other public borrowers are scrambling to refinance tens of billions of dollars of debt this year, another sign that the once-safe market is under duress.


Fed Moves To Gut Predatory Lending Regulation 
The Federal Reserve is pushing a new mortgage regulation that would effectively eliminate the most powerful federal remedy for predatory lending.

Jobless Claims Jump, Wholesale Food Costs Surge 
Published: Thursday, 13 Jan 2011 | 9:31 AM ET
U.S. jobless claims jumped to their highest level since October while food and energy costs boosted producer prices, pointing lingering headwinds for an economic recovery that had been showing renewed vigor.
A surge in exports to their highest level in two years helped narrow the trade deficit, however, an encouraging sign.

Banks repossessed 1 million homes last year — and 2011 will be worse 
First quarter of the year will likely show a rebound in foreclosure activity 
By JANNA HERRON – NEW YORK —


 The bleakest year in foreclosure crisis has only just begun. Lenders are poised to take back more homes this year than any other since the U.S. housing meltdown began in 2006. About 5 million borrowers are at least two months behind on their mortgages and more will miss payments as they struggle with job losses and loans worth more than their home’s value, industry analysts forecast.




Thursday Recap: A Look inside the markets

SPX going to end up 7 weeks in a row!


On Thursday overnight auctions in Spain and Italy were considered successful as Spain raised as much money as they had hoped and the rate increases for both auctions weren't significant. The Labor Department reported the Producer Price Index (an indication of inflation at the wholesale level) for December rose by +1.1%, which was above the consensus estimate for +0.9% and above November’s +0.8% (October: +0.4%). When you strip out food and energy, the so-called Core PPI came in up +0.2%, which was inline with the consensus for +0.2% and below November’s +0.3%. The Labor Department also reported that initial claims for unemployment insurance for the week ending January 8 rose by 35K to 445K. The week’s total was well above the consensus for a reading of 409K. Continuing Claims for unemployment for the week ending January 1 were below consensus at 3.879M vs. expectations for 4.06M and last week’s revised (higher) 4.124M. Futures were modestly negative as the open approached.

Yesterday's session began without a significant gap and quickly moved lower to put the low of the day on the chart at 10:11 am. But every dip must be bought and this one followed the pattern as the index began crawling higher. Then the index double topped at 11:38 and 12:18 before gently declining much of the afternoon. But this was a tight range session and all moves were tiny. The low of the day was put on the chart at 3:34 and the final half hour was mostly a small bounce higher as dip buyers arrived.


The SPX Index there were 220 components advancing and 260 components declining. On the NYSE 3,134 issues were traded with 1,370 advancing issues and 1,651 retreating issues, a ratio of 1.21 to one declining. There were 246 new highs and 108 new lows. The five day moving average of New Highs is 212 while the five day moving average of New Lows is 36 and the ten day moving average of Net Advancing is 220. The Net Advancing data indicates a bullish trend.
 
Declining volume was higher at a ratio of 1.57 to one. The closing TRIN was 1.31 and the final tick was 734. The five day average of TRIN is 1.02 and the ten day average of TRIN is .95. The NYSE Composite Index lost -0.05% today while the SPX lost -0.17%.
 
For the NYSE, relative to the previous 30 session average, volume was -1.81% below the average. Of the last 15 sessions 6 sessions ended with volume greater than the previous rolling 30 day average volume. Of the last 30 sessions, 21 sessions ended on a positive tick, 9 of last 10. For the SPX, the day's volume was 94.3% of the average daily volume for the last year. Volume was 111.6% of the last 10 day average and 105.5% of the previous day’s volume.
 

Total tick for the day was -75,000 and the average tick for the day was -49. There were 15 ticks greater than 600 and 48 ticks more extreme than -600. There were no ticks greater than 1000 and 3 ticks more extreme than -1000. The tick action suggests institutional distribution.
 
The intraday volume's largest spikes today came on the down moves. But in such a tight range of trading it is difficult to draw much from such a pattern. But looking at the Nightly Breadth Indicators is of interest tonight, particularly the spike in the High Low Logic Index. This is by far the largest one day spike we have ever seen in this indicator with yesterday's spike being the largest in two years. So the two day spike is either a clue or a total anomaly. It bears watching over the next few days.


Yesterday was another one of those days that looks like a minus 1% day rather than minus 0.17%. 108 New Lows today. The real losers on the day were the commodities related names, metals and miners were hammered even as the dollar got blasted. The FXE (EURO ETF) was up more than 1.5%. 


This was a big negative day for those of us who are subscribing to the theory that things aren't going to get better anytime soon. That inflation is real and its here to stay, and that easing around the world has to continue (right or wrong), as will efforts to promote job growth and stabilize the financial system and stem deflation/depression. And until that changes I will stick to what works in that environment, though it doesn't seem to work everyday as we saw yesterday, and this morning gold and silver are down again even as the dollar is weak. It seems to me that the metals dollar inverse correlation has been lost and not the metals are more closely related to the perceived well being or problems in Europe. When the Euro is stronger based on the bond auctions etc and people feel better about Europe, they sell gold, silver etc. This confusion is creating volatility in the metals, funds are buying and selling based on the daily news flow. I think its time to take a step back and see the forest through the trees.

Thursday, January 13, 2011

Total Gain/Loss 23%

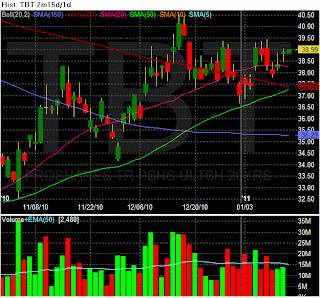
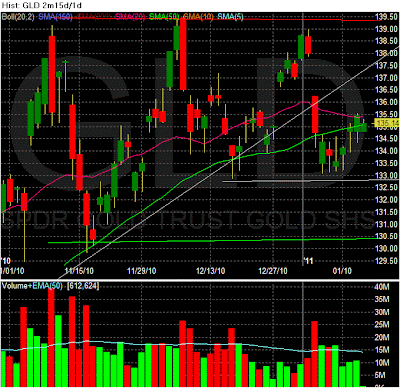
TBT, GLD, SLV, URZ, CCJ, UEC, GDXJ, DBA, XLE all equally weighted  so far the gain is 23%
compared to the S&P which is up 8% over this period from 10/29/10 to 1/13/11

GLD SLV XLE DBA

up 2.8% since 2.8%
up 22% since 10/29/10


up 18.8%

up 10.4 %

Bonds Dollar TBT EUR

Since 10/29/10 TLT (Long bond is down 8%)

up 13.4 % since 10/29/10


up 2.8% since 1/29/10


The only reason the dollar has held up is because of all the problems Europe is having, as those issues improve the US debt will continue to grow,, you read what Bernake is telling people about the economy, and his fear of deflation and his knowledge of the depression and he will QE to infinity if needed. I don't think Europe will follow the US further into the debt abyss over the next 3-5 years. Some of the states are much bigger than countries in Europe, and they are unable to print money like countries do. Newt Gingrich is on the record as saying which should let states go bankrupt, and what will happen to state jobs, police, sanitation, fire fighters other municipal services and pensions etc. 


down 5%


Uranium Miners Follow UP


I started writing this blog on 10-29-10, at that time I spoke of my plan for making profit from this easing cycle the coming inflation and higher energy prices, and the need for new nuclear power plants (aging plants) so I wanted to see how that is actually playing out. This group has been left for dead for a long time and is now at the beginning of a secular bull market.  CCJ was trading at 30.26 and on 11-9 I wrote that my near-term target was 41 dollars a share it actually made it there earlier this year and is off a bit from there. As of today the gain in CCJ is over 30%.

URZ up 86%


UEC up 52%, it hit a high of 7.4 and its going to test that area very soon.


Wednesday Recap: A Look Inside the market


NEW BREAKOUT FOR SPX
There was a key development yesterday morning and that was the European Central Bank's participation in the Portuguese bond auction. With traders concerned that a lack of participation would lead to market collapse, they all had to cover their hedges and that pushed the markets higher. The US government reported that Import Prices for the month of December rose by +1.1%, which was below the consensus for an increase of +1.2%. The November reading was revised higher to 1.5% from 1.3%. And Export prices rose by +0.7%, below last month’s unrevised +1.5%. Stock futures were strong before the open.

The session began with a small gap higher but the SPX was up seven points in the opening moments. After a very shallow decline the index resumed moving higher. After a steady gentle incline until about 11:15the index stalled and traded within a two point range for four hours. The final hour saw a small amount of profit taking but it was extremely mild as the index closed just off the session highs.

Right now fund managers and retail investors have a strong fear of missing the next leg up in this rally. Its all going to end badly, just don't know when. But it seems I have been saying that for the past 6months so I give up. As long as there is QE and bailouts, markets are going to keep going higher.


For the SPX Index there were 392 components advancing and 87 components declining. On the NYSE 3,142 issues were traded with 2,187 advancing issues and 876 retreating issues, a ratio of 2.5 to one advancing. There were 310 new highs and 42 new lows. The five day moving average of New Highs is 203 while the five day moving average of New Lows is 16 and the ten day moving average of Net Advancing is 253. The Net Advancing data indicates a bullish trend.
 
Advancing volume was higher at a ratio of 4.81 to one. The closing TRIN was 0.52 and the final tick was 650. The five day average of TRIN is 1.02 and the ten day average of TRIN is .94. The NYSE Composite Index gained 1.3% today while the SPX gained 0.89%.
 
For the NYSE, relative to the previous 30 session average, volume was .92% above the average. Of the last 15 sessions 6 sessions ended with volume greater than the previous rolling 30 day average volume. Of the last 30 sessions, 21 sessions ended on a positive tick, 8 of last 10. For the SPX, the day's volume was 92.5% of the average daily volume for the last year. Volume was 112.3% of the last 10 day average and 103.3% of the previous day’s volume.
 
Breadth was strong as was advancing volume. The NYSE Composite Index continues to outperform the SPX.
 
Total tick for the day was 133,000 and the average tick for the day was 86. There were 20 ticks greater than 600 and 19 ticks more extreme than -600. There were no ticks greater than 1000 and no ticks more extreme than -1000.
 
Volume spiked early today on the up moves but also spiked late day on the mild decline. It is interesting - and unusual - to see the volume decline after 3:30 as the close is most often a period of high volume.


Financials and energy issues significantly out performed the SPX, and basic materials were strong as well on a relative basis. Under-performers were consumer discretionary, utilities and healthcare. 

Wednesday, January 12, 2011

News

TELEGRAPH 
Deepening crisis traps America’s have-nots 
The US is drifting from a financial crisis to a deeper and more insidious social crisis. Self-congratulation by the US authorities that they have this time avoided a repeat of the 1930s is premature. 
By Ambrose Evans-Pritchard

http://www.telegraph.co.uk/finance/comment/ambroseevans_pritchard/8249181/Deepening-crisis-traps-Americas-have-nots.html


Gingrich Proposes Allowing State Bankruptcies, To Escape Pension Obligations By John Keefe | Jan 11, 2011


http://moneywatch.bnet.com/economic-news/blog/macro-view/gingrich-proposes-allowing-state-bankruptcies-to-escape-pension-obligations/2967/


MARKETWATCH.COM
About gold, Schultz retains his long-term bullishness. He quotes the respected Seeking Alpha service:
“For gold to match the growth in US M1, M2, public debt & budget deficit, gold will have to reach $1,800, $2,400, $7,800 & $13,200, respectively. While I can’t imagine gold going to $13k, these numbers tell me that calling gold a bubble is a bit premature. In my view, money supply, public debt & the budget deficit are in a bubble, not gold, not yet.”
Schultz’s comment: “Wake me up at $2,400 gold.”

Tuesday, January 11, 2011

DXY GLD SLV CCI

There seemed to be a general reflation type of trade back in play yesterday although it was mixed in the sense that the bonds were a bit higher which generally does not jive with the return of risk trade and Copper was lower which sends a mixed signal.
The grains however were very strong with beans and corn leading the way. Crude moved higher on news of a drop off in oil moving through the Trans Alaska Pipeline due to a  leak.
The Dollar was slightly lower and equities were a tad lower leading to some conflicting short term signals for traders to sort through.
 US Dollar is continuing to exert pressure on the overall level of commodity prices, I am not so sure that we are going to see a direct link reassert itself to the degree where we have nearly every tick higher in the Dollar followed by a tick lower in commodities. There are certain commodity markets which have a set of fundamentals that are strongly bullish (Precious metals, grains, beans, rice). While those markets are indeed influenced by inflows of hot money flows (mostly tied to industrial and manufacturing) and would tend to move lower while the Dollar moves higher, where the fundamentals are very strong (see previous posts) fundamentals are so strong that downdrafts are going to be bought, regardless of what the dollar does. 
Recent economic data has given proponents of an improving economy some reason to support the view of the so-called “economic recovery” in the US, but the fact is that job creation is practically non-existent. Even those jobs which are being created are not sufficient to keep up with just the increase in the numbers of job those still looking for work. 
I believe the market is looking past the various data releases and more focused on the fact that this critical aspect of any true recovery, jobs etc, remain weak and will remain sluggish for the foreseeable future. Fed Chairman Bernanke as much as said the same in his comments last week.
The stock market and the bond market is telling you that it expects  the QE policy is not going to go away and is convinced that inflation is in its future. That means the bullish trend in commodities as a whole will continue until or unless there is a CLEAR SIGNAL that the number of jobs being created is of sufficient size that QE will no longer be necessary. 
The price action of the overall sector as indicated by the CCI is reflecting this view as it is more suggestive of a lull in buying rather than the beginning of a sustained downtrend. I think we are seeing this reflected in the gold market which while it cannot yet manage to climb back above $1400 and reassert another leg in its long term uptrend, does not appear to want to break sharply lower either.
We will know whether this is indeed the case if the Dollar manages to punch through the 82 level on the $DXY and closes there on a weekly basis. We will have to stay tuned and watch developments in real time to see where we head next.
But when looking at the dollar strength we must not forget that its not the improving fundamentals in the US but worsening in Europe.  As long as Euro based problems are lingering the dollar will remain relatively strong and there are those out there floating the idea that QE will end sooner than most expect. 
Short term the markets are giving off mixed signals which is indicative of uncertainty on the part of traders. Some are moving to the sidelines or lightening up a bit as they wait to gauge future direction. In addition, we are still going to be dealing with index fund rebalancing which further clouds the analysis. In the long term  , the damage associated with a $14 Trillion national debt  is not going to go away, nor are the effects of QE is doing in terms of inflation creation.

Monday Recap: A look inside the market


Monday morning it looked like the bears were going to have a big day as concerns regarding Europe were driving world markets lower. The problems in Portugal looking like they could be reaching a boiling point. With a big auction in Portugal scheduled for Wednesday (see link below), this issue could come to a head in the next couple days. 

The week began with a small gap down. The index quickly shed a total of seven points before bouncing several points. But before 10am the index again headed lower again to put the low of the day on the chart right at the top of the hour. And then yet again the dip buyers arrived to take the tape higher off the lows as this was another frustration for the bears. After a choppy morning the rest of the session gradually traded higher with the high of the day in the last half hour.

The 1262 area is clearly setting up as a zone of support as three of the last five sessions have bottomed and bounced from that area. We have now essentially gone sideways sine the large opening gap on the first session of the year. The opening hour of the year closed at just below 1273 and today's close was a fraction below 1270. So the trend certainly is more sideways than either higher or lower. Yet this market appears to be consolidating sideways. This is constructive and long term bullish.


For the SPX Index there were 235 components advancing and 246 components declining. On the NYSE 3,129 issues were traded with 1,567 advancing issues and 1,471 retreating issues, a ratio of 1.07 to one advancing. There were 133 new highs and 13 new lows. The five day moving average of New Highs is 180 while the five day moving average of New Lows is 9 and the ten day moving average of Net Advancing is 138.
 
Declining volume was higher at a ratio of 1.21 to one. The closing TRIN was 1.29 and the final tick was 650. The five day average of TRIN is 1.05 and the ten day average of TRIN is 1.. The NYSE Composite Index lost -0.18% today while the SPX lost -0.14%.
 
For the NYSE, relative to the previous 30 session average, volume was -1.85% below the average. Of the last 15 sessions 5 sessions ended with volume greater than the previous rolling 30 day average volume. Of the last 30 sessions, 20 sessions ended on a positive tick, 6 of last 10. For the SPX, the day's volume was 85.8% of the average daily volume for the last year. Volume was 121.2% of the last 10 day average and 78.9% of the previous day’s volume.
 
Breadth was slightly positive today but the volume was in the declining stocks. This remains a very weak rally or a very weak pullback.
 
Total tick for the day was 138,000 and the average tick for the day was 89. There were 122 ticks greater than 600 and 58 ticks more extreme than -600. There were no ticks greater than 1000 and 1 tick more extreme than -1000.
 
Intra-day volume tapered off after the early morning selling and the most notable volume spike came around 2:30 on a down move. Checking the Nightly Breadth indicators still has a bearish look. The McClellan Oscillator still looks bearish as does the Summation Index. Once again, the numbers look more like a 1% down day but be only lost a sixth of that.


MORE QE
http://www.reuters.com/article/idUSTRE70A10U20110111?feedType=RSS&feedName=businessNews&utm_source=feedburner&utm_medium=feed&utm_campaign=Feed%3A+reuters%2FbusinessNews+%28News+%2F+US+%2F+Business+News%29


http://www.bloomberg.com/news/2011-01-11/portuguese-bond-buyers-set-to-demand-unsustainable-yields-euro-credit.html

Monday, January 10, 2011

Friday's Recap: A look inside the market


The Labor Department reported that Nonfarm Payrolls, rose in the month of December by 103K. This was below the consensus estimates for an increase of 172K and well below the "whisper numbers" for something on the order of +190K. The private sector showed gains of 113K jobs, which was also well below the estimates for 187K. However, the nation’s Unemployment Rate dipped to 9.4%, well below the expectations for a reading of 9.7% and November’s level of 9.8%. October & November payrolls were revised higher by +70K while the Private Payroll numbers were revised higher by +62K. Foreign markets were mixed with many hovering near breakeven.

The session began with a small gap higher and quickly moved upward three points to put the high of the day on the chart just six minutes after the open. Several waves of selling hit the tape taking the index down fourteen points but just before 1pm dip buyers jumped into the fray and the afternoon belonged entirely to the bulls. Buyers relentlessly ran the tape higher all afternoon pumping the index upward more than ten points off the lows.

The high of the day was still in the opening hour, a bearish characteristic, and the index closed down for the day. But the afternoon did not feel bearish in any fashion as the bulls seemed to recover with ease from the morning sell off.


The SPX gained 13.86 points during the week. The range for the week was 20.55 points, 1.63%. The four week RSI of the four indices (SPX, Dow, NASDAQ, and Russell 2000) is 86. Pullbacks often occur as this RSI reaches 80 and bounces near 20.

Total tick for the week was 244,000. On the NYSE, the advance/decline line increased during the week by 256 and the 10 day average of Net Advancing decreased from 346 to 163.

This was another odd week. Three days were down, there were almost four times as many negative 1000 ticks as positive 1000 ticks, yet here we are up almost 14 points. There is clearly market manipulation at hand because at least twice this week when the market was threatening to breakdown someone came into the futures market and started buy blocks of ES contracts at 9999 contracts a block. Whoever it is has a lot more money to lay out than you or me (Guess who?)and they were willing to put that money at risk at very vulnerable times. But it was effective each time because it immediately turned the markets higher.


For the SPX Index there were 201 components advancing and 276 components declining. On the NYSE 3,146 issues were traded with 1,334 advancing issues and 1,706 retreating issues, a ratio of 1.28 to one declining. There were 141 new highs and 9 new lows. The five day moving average of New Highs is 177 while the five day moving average of New Lows is 7 and the ten day moving average of Net Advancing is 163.
 
Declining volume was higher at a ratio of 1.48 to one. The closing TRIN was 1.16 and the final tick was 674. The five day average of TRIN is .9 and the ten day average of TRIN is .97. The NYSE Composite Index lost -0.26% today while the SPX lost -0.18%.
 
For the NYSE, relative to the previous 30 session average, volume was 14.% above the average. Of the last 15 sessions 6 sessions ended with volume greater than the previous rolling 30 day average volume. Of the last 30 sessions, 19 sessions ended on a positive tick, 6 of last 10. For the SPX, the day's volume was 108.5% of the average daily volume for the last year. Volume was 168.7% of the last 10 day average and 102.5% of the previous day’s volume.
 
The market breadth clearly suggests that Friday should have been down close to 1% yet the SPX didn't even manage one fifth of that. There isn't much new to be said; it's all been said.
 
Total tick for the day was -42,000 and the average tick for the day was -27. There were 71 ticks greater than 600 and 85 ticks more extreme than -600. There were 1 ticks greater than 1000 and 11 ticks more extreme than -1000.
 
Intra-day volume clearly spiked on the down moves and diminished on the up moves. Looking at the Nightly Breadth indicators show a bearish trend. But Price continues to creep higher.