Saturday, March 05, 2011

Secular Trends Portfolio Update, Predictions Review

With two months in the books and my Blog portfolio up 37% (this does not include trades I made on CRUS and RES that netted 20%, and small losses in say like the BGZ -2.5%), since I began writing I thought its time to re-evaluate my positions and take a look at the predictions I made for 2011.

So what was my strategy, it was basically a play on our debt, weakening of the dollar, inflation run wild, increasing money supply and its consequences.

My theory was and still is that the major debt holders China, Japan, and UK will start dumping our bonds and I said that I would short the long bond using TBT.

Long Bond ETF (Short)

13 Percent gain, but don't forget this will take years to play out and one can sit back and enjoy this ride, our policies are not going to change, folks in Washington can't help but spend money. If the money printing stops and we have substantial budget cuts and they tell us, ladies and gentleman were gonna have a couple of really bad years and we'll fix this thing then the trade is off, its that simple.

Next I spoke about weakening of the dollar against other currencies. Since the start of this blog the dollar is down 2% against major world currencies, and if you think two percent isn't alot in currency trade its huge. I don't know jack about currency trading, but do your own homework you'll know what I'm talking about.
Just look at dollar ETF since they announced QE last summer and the S&P took off.

This is one scary chart, God help us!

Inflation run wild: Metals, Energy, Food, Ag all are sky rocketing, Uncle Ben says ex; food and energy there is no inflation. Its so funny, ex food, (isn't that what  these riots are about, people are starving). Imagine if food and energy was no longer pegged to the dollar and you could buy it Rubles etc, then there would be no ex-food and energy in those statements and we'd be out in the streets. And I know we don't really care about "those" people, not really, its just cause of the oil! 

Regarding commodity prices, I refer you to just todays headlines on Bloomberg (commodities section). Just look at todays headlines!

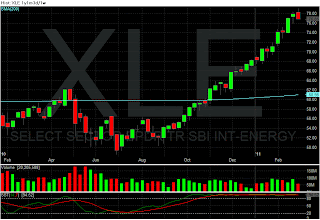
Energy Large Caps


Since I started writing this blog XLE is up 32%, MOO Ag ETF is up 12%, DBA  soft commodities 18%, URA, uranium miners 27%, URZ 108% and UEC 58%, and CCJ up 32%. In case you think you missed something and its too late, I would have to re-think that. Just look at what is bringing us here to this point where oil is over a hundred. We are right at pre-crisis awareness (dollar/debt) levels. The shit hasn't hit that fan yet. The uranium miners have pulled back substantially and its a good time to step in. I'd use a stop 5-8 percent below the 50dma to minimize loss on a new entry.

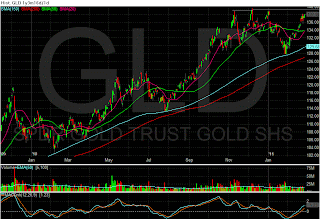
Now on to the metals and miners, GDXJ is up 12.5%, and GLD is up a 6.25% since 10/29/10. Silver ETF SLVand Silver miners ETF SIL, are up 48 and 41% respectively. 


If you don't have any silver yet please read this interview!
http://www.sprott.com/Docs/MediaCoverage/2010/globe.pdf

Japanese large cap ETF

On January 3rd I spoke of some predictions for the coming year. 

1. More QE talk: Bernanke hinted it on 60minutes and in Bloomberg Interview (QE3): Check!
2. Commodity Inflation: Check! see coco, sugar, silver, gold, cotton, oil, copper etc etc
3. 20 Year Bear market in Japan will end. Check! So far so good!  
4. Not here in the US but riots in Middle East, Africa and China over food inflation.
5. Still no talk about alternative energy as oil over 100
6. Alternative Energy Uranium Play, Check!


we'll see about the rest as the year plays out


Record Food Prices May Persist as Economic Growth Boosts Demand, IMF Says

Record worldwide food prices may remain high because the output response needed to ease supply concerns may take years, the International Monetary Fund said.

Increasing incomes in developing countries have boosted demand for meat and dairy, requiring more grain for livestock feed and land for grazing animals, Thomas Helbling, an adviser for the IMF’s research department, and Shaun Roache, an economist, wrote in an article. Rising demand for biofuels and adverse weather also have tightened food supplies, the IMF said.

“Over time, supply growth can be expected to respond to higher prices, as it has in previous decades, easing pressure on food markets, but this will take time counted in years, rather than months,” according to the article published yesterday in the agency’s Finance & Development magazine.

The global food price index, compiled by the United Nations’ Food & Agriculture Organization, surged to a record in February as all food groups except sugar rose, the agency said yesterday. Rising food costs and corruption sparked political unrest across North Africa and the Middle East, ousting leaders in Tunisia and Egypt, the largest buyer of wheat.


 Read More

Hedge Funds Borrow the Most Since 2007 to Purchase U.S. Stocks

Hedge funds increased their net leverage in January to the highest level since October 2007, as they took advantage of record-low borrowing costs to bet that the U.S. equity rally will continue.

Debt at margin accounts at the New York Stock Exchange minus cash and unused credit from margin accounts climbed to $46 billion, according to data released by NYSE yesterday. Hedge funds had $290 billion of debt from margin accounts in December, the largest sum since Lehman Brothers Holdings Inc. collapsed in September 2008.

“It makes a lot of sense given the low cost of borrowing and some equities’ valuations,” said Patrick Armstrong, who helps manage $356 million in multiasset strategies at Armstrong Investment Managers LLP in London. “There is a capital- structure arbitrage to be made by buying stocks with leverage.”

Money borrowed at NYSE can help gauge speculators’ bullishness toward stocks; peaks in loans to investors have preceded market tops in the past. Margin debt peaked in February 2000 and in July 2007, before stocks plunged. Unused credit in margin accounts rose to a record high of $386 billion in August 2008, about seven months before the Dow Jones Industrial Averagerebounded from a 12-year low to start an 85 percent rally to date.


Read More

China's Wen Targets Inflation as Top Priority

Fighting inflation is China’s top economic priority this year as the government aims to limit the risk of social unrest, PremierWen Jiabao said in his state-of- the-nation speech.

“We cannot allow price rises to affect the normal lives of low-income people,” Wen said in a report to the annual meeting of the National People’s Congress in Beijing today. “This problem concerns the people’s well-being, bears on overall interests and affects social stability.”

Wen, 68, confirmed targets of 4 percent for full-year inflation and 8 percent for economic growth, as the Communist Party seeks to maintain support for its 61-year rule. In the past two weekends, the government has deployed hundreds of police in Beijing and Shanghai after Internet calls for so- called Jasmine protests, inspired by revolts in the Middle East and North Africa.


Friday, March 04, 2011

UUP: Dollar Index ETF

NOW AT LEVELS BELOW THE  FINANCIAL CRISIS 08


Purpose of the UUP:
designed to replicate the performance of being long the US Dollar against the Euro, Japanese Yen, British Pound, Canadian Dollar, Swedish Krona and Swiss Franc.


There was a time when people ran to the dollar in times of turmoil, not now folks. this is a huge signal of impending doom for the once almighty reserve currency. Collapse is more likely the result but its going to take a very long to happen (maybe by QE 10) but it will no doubt happen because no one wants to spend less, take a hit, they want you in the malls shopping, using your credit card, everything is fine. This FED is shameful and irresponsible in their actions. God help us if dollars are no longer required for the rest of the world to buy commodities, we'd be seriously screwed! 

I went on the Yahoo message boards just to see sentiment, and you would not believe the amount of posts that are bullish on the dollar right here at these levels. Blows my mind!

BofA Downgrades Goldman and Citibank

BoA's Guy Moszkowski says the big concern is cash flow, especially as regulations take effect and customer risk appetite falls:

Downgrading Citi and GS to Neutral. POs cut. Common denominator: expected weakness in Q1:11 results. Results unlikely to be dismal, and should show improvement over Q4, but we don’t expect seasonal improvement as strong as often seen in the past. Client engagement remains subdued, Mid-East turmoil likely only to further reduce customer risk appetite. Thus we are making significant cuts to our forecasts, and expect consensus to decline over the coming weeks. Increasingly, we believe investors will look to the theme of improving cash flow/ return of capital via dividends/ buybacks, and also to play financials that are less– or even positively – affected by restrictions on banks such as Volcker Rules. In our coverage, this includes names such as BX and KKR, as well as LAZ. This, together with low valuation relative to current earnings, drives keeping JPM “Buy”.


Fourth Time A Charm?

I have been wrong on calling a top since last summer and I have had to fight myself from repeating the same mistake, going short that is, the market thats been on crack (QE) from months now. This does feel a little different, I think everyone is so used to buying the dips and making money that confidence in that trend is high, initially as with every downturn there is that snap back as people think its business as usually. Its only after being rejected a few times do they start saying are we having a correction and thats when the sell-off accelerates.


So lets look at the headlines, what the NFP numbers weren't good this time, weren't they better than expected, no how come? Are now worried about oil, ow come yesterday we werent? This is just utter non-sense, an excuse to sell. The failure to break out above tuesday's high is extremely bearish in my view and I think yesterdays rally was based on nothing, hence no follow through.

Oh and by the way Silver is up 3%, thanks Dennis Gartman for selling your longs, I think he's buying em back for much more today than he got for em yesterday. As for JPM and HSBC we'll see some sharp action as they cover their shorts, I hear they have big short position at 35 dollars, were at 35.12 on the physical. As for me I sold half my position in Silver yesterday, up 53% since october, didnt wanna be too greedy. I'll buy it back on the next pullback. I hope we get one before we hit that 40 dollar level.

Tata Motors: TTM


The Sensex or Bombay Stock exchange has been hammered over 20% and I feel like their market is stabilizing and building a base. As we all now bottoming is a process and I hope to see sideways action after this rebound and a good way to play this market is TTM. I am going to open a half position and put a stop under the 200dma and will buy the rest above the 150dma. This offers good risk reward. Looking for a target for 38 to 40 by year end.

Must Read: A Conspiracy With a Silver Lining by William Cohan NYT

As Americans know all too well by this point, commodity prices — for corn, wheat, soybeans, crude oil, gold and even farmland — have been going through the roof for what seems like forever. There are many causes, primarily supply and demand pressures driven by fears about the unrest in the Middle East, the rise of consumerism in China and India, and the Fed’s $600 billion campaign to increase the money supply.

Nonetheless, how to explain the price of silver? In the past six months, the value of the precious metal has increased nearly 80 percent, to more than $34 an ounce from around $19 an ounce. In the last month alone, its price has increased nearly 23 percent. This kind of price action in the silver market is reminiscent of the fortune-busting, roller-coaster ride enjoyed by the Hunt Brothers, Nelson Bunker and William Herbert, back in 1970s and early 1980s when they tried unsuccessfully to corner the market. When the Hunts started buying silver in 1973, the price of the metal was $1.95 an ounce. By early 1980, the brothers had driven the price up to $54 an ounce before the Federal Reserve intervened, changed the rules on speculative silver investments and the price plunged. The brothers later declared bankruptcy.

Read More


http://seculartrends.blogspot.com/2011/02/what-else-could-this-be-but-buggery.html

Thursday Recap: A Look inside the markets, TOPPING?

The futures are up slightly after an explosive up move yesterday. Bloomberg is reporting that the FED favors ending the bond purchases in June but the article goes on to say "they must be confident that the economy is strong enough to endure higher long-term interest rates". Read More

Oil is rising again (as is gold), the news out of Libya isn't good today, as the conflict there seems to be accelerating. Read More

Yesterdays Recap: The markets were pumped up as word of a peace deal for Libya being brokered by Venezuela's Hugo Chavez. While there is no official confirmation, oil was lower and stocks higher. The government reported U.S. Nonfarm Productivity in the fourth quarter rose by +2.6%, which was above the estimates for reading of +2.4%. On the inflation front, Unit Labor Costs were reported to have fallen -0.6% versus the expectations for -0.5%. Q3’s reading was unrevised at -0.6%. Initial Claims for Unemployment Insurance for the week ending 2/26 were reported to have fallen by 20K to 368K. This was well below the consensus estimate for 398K and last week’s total of 388K. Continuing Claims for the week ending 2/19 came in at 3.774M vs. 3.80M and last week’s 3.833M.

A closer look at the numbers reveals the truth about the claims numbers. The truth is that the number of people filing extended benefits increased to 850,372 - or an increase of 88,689 from the previous week. In effect, the number of total jobless claims actually increased by 68,689, the difference between weekly and extended. But the Government and media only report the weekly number in the headline. If you wanna check the math here is the DOL  
Link.


The session began with a huge gap higher and continued higher the first half hour before catching a breather. But this was a multi-wave assault by the bulls as the index never really let up. The largest pullback of the day came in the final hour and it amounted to only about three points as the index climbed steadily throughout the session to close near the highs.


If you look back to Tuesday morning we had a gap up to 1332 level and to me its interesting where Thursdays rally ended, you guessed it right at Tuesdays high. Lets see if there is a follow through today, futures are up a little, I'll be wrong for the 4th time in saying this is a topping pattern, if at first you don't succeed, LOL.

All the breadth numbers are bullish without any real sign of a weakness. The weakest thing to be pointed out is that the NYSE slightly underperformed the SPX. The bulls owned this one and if you were short you paid dearly. Ah hum! I Got stopped out at the open taking a 2.5% loss (BGZ).

The intraday volume pattern should be a concern for bears. Notice how the relative volume crept higher throughout the afternoon. Looking at the Breadth Indicators we still have a mixed bag. But it's impossible to not comment on the McClellan Oscillator which has not reached overbought territory.


For the SPX Index there were 452 components advancing and 26 components declining. On the NYSE 3,145 issues were traded with 2,485 advancing issues and 568 retreating issues, a ratio of 4.38 to one advancing. There were 228 new highs and 4 new lows. The five day moving average of New Highs is 188 while the five day moving average of New Lows is 13 and the ten day moving average of Net Advancing is 228. The Net Advancing data was extremely bullish.


Sectors stronger than the SPX for Thursday:
- Basic Materials -- Outperformed the SPX by +13%.
- Financials -- Outperformed the SPX by +22%.
- Industrials -- Outperformed the SPX by +68%.
- Health Care -- Outperformed the SPX by +34%.
- Consumer Discretionary -- Outperformed the SPX by +5%.

Sectors weaker than the SPX for Thursday:
- Energy -- Underperformed the SPX by -2%.
- Technology -- Underperformed the SPX by -16%.
- Consumer Staples -- Underperformed the SPX by -69%.
- Utilities -- Underperformed the SPX by -58%.

In Summary: The market does not care about food inflation, national debt, unemployment, middle east crisis, 100 dollar oil, it just needs more CRACK, I mean QE. Party on Garth!


Thursday, March 03, 2011

Food prices hit new record highs: BBC

The UN's Food Price Index rose 2.2% in February to the highest level since the UN's Food and Agriculture Organization (FAO) began monitoring prices in 1990.

It also warned that spikes in the oil price could make the "already precarious" situation in the food market even worse.

Apart from sugar, the FAO said all commodity groups had risen in price.

Oil prices recently hit two-and-a-half year highs due to political unrest in North Africa and the Middle East.


Metals Update

I wrote about the amount of shorts that are in the silver market yesterday, and I think its caused me to overlook what my target was on this break out. If you look at SLV, it went from 30 to 26 and broke out at thirty, I was expecting a 4 dollar move and we got that. The other thing that has caused me to not respect the technicals is the news and the breakout in gold. So I didn't sell yesterday and though its not down big this am, I'm going to sell half of my position. If i'm wrong I can always buy it back. Ah, the problem with timing!

I don't think we get back to 30 but 31-32 is possible.
In the physical markets: Gold closed today at comex closing time at $1437.20 up $6.50, open interest rose by 6000 contracts and the volume was strong in gold yesterday The estimated volume at the comex today was quite good at 152,539. 

Silver was also up, rising by 40 cents to $34.81. The banksters were intent today to restrict the rise in these two precious metals. They tried to influence their downward movements in the early hours of the morning. However the strength on the buy side was just too great for the crooked ones. Thus gold closed at a record level price of $1437.20 and even touched $1440.00 and silver just about hit$ 35.00 per oz. 

The OI fell again in silver by 412 contracts and the volume was rather light as well, 45,000 contracts. 


Wednesday Recap: A Look Inside the market

Futures are up over 8 points mainly due to the peace proposal in North Africa. Other news in the works is the ECB meeting, and we have data out later this morning, so we shall see. Yesterday, oil futures moved above $101 and stock futures moved correspondingly lower. Challenger, Gray & Christmas reported that planned job cuts rose in February. However ADP reported that the private sector job market expanded during the month of February. The report showed that private sector jobs rose by 217K jobs during the month, which was above the consensus expectations for a gain of about 167K.

The events in middle east and africa have been driving this market (mostly due to oil), this morning futures are up due to peace talks. That should take out the failed moves by a big margin. But will it hold?
The Wednesday session began without a significant gap, traded slightly lower briefly and then ascended until a bit after 11:00 am and put the high of the day on the chart. The following hour surrendered twelve points to put the low of the day on the chart at 12:02. The rest of the session whipsawed back and forth in a narrow but tradable range with a generally bullish bias. But the final hour wiped away several points of gains.

Once again we see a session with the high early in the day. Indeed, the character of the market has changed from what we saw for several months.

For the SPX Index there were 301 components advancing and 178 components declining. On the NYSE 3,129 issues were traded with 1,920 advancing issues and 1,106 retreating issues, a ratio of 1.74 to one advancing. There were 73 new highs and 18 new lows. The five day moving average of New Highs is 199 while the five day moving average of New Lows is 16 and the ten day moving average of Net Advancing is 189.

Advancing volume was higher at a ratio of 1.62 to one. The closing TRIN was 1.07 and the final tick was 741. The five day average of TRIN is 1.4 and the ten day average of TRIN is 1.26. The NYSE Composite Index gained 0.28% today while the SPX gained 0.16%. Today's volume pattern clearly shows a spike in volume as the index sold off just before noon and then diminishing volume later in the afternoon as the index rose.

Breadth was moderately strong today but advancing volume was unconvincing. Yet the broad NYSE Composite Index outperformed the SPX and the ten day Net Advancing is approaching 200. The data suggests caution either side as this is luke-warm data.

Total tick for the day was 120,000 and the average tick for the day was 77. There were 137 ticks greater than 600 and 84 ticks more extreme than -600. There were 2 ticks greater than 1000 and no ticks more extreme than -1000. The tick action suggests institutional accumulation.

Sectors Performance:
- Basic Materials -- Outperformed the SPX by +20%.
- Energy -- Outperformed the SPX by +41%.
- Industrials -- Outperformed the SPX by +31%.
- Technology -- Outperformed the SPX by +45%.
- Utilities -- Outperformed the SPX by +8%.
- Health Care -- Outperformed the SPX by +11%.
- Consumer Discretionary -- Outperformed the SPX by +23%.

Sectors weaker than the SPX for Wednesday:
- Financials -- Underperformed the SPX by -83%.
- Consumer Staples -- Underperformed the SPX by -50%.


Wednesday, March 02, 2011

Every bounce gets sold!

Bernanke On Gold Standard

By Michael R. Crittenden
Dow Jones Newswires
via The Wall Street Journal
Tuesday, March 1, 2011
http://online.wsj.com/article/BT-CO-20110301-714533.html

WASHINGTON -- Federal Reserve Chairman Ben Bernanke defended the central bank's effect on the dollar Tuesday, pushing back at the idea that policy makers should consider alternative proposals like the gold standard.
Bernanke, appearing before the Senate Banking Committee, was pressed by Sen. Jim DeMint, R-S.C., on the viability of a return to a gold-backed economy or the idea of the Treasury Department issuing bonds payable in gold.
Bernanke, who has studied the issue, said a return to the gold standard wouldn't work.
"It did deliver price stability over very long periods of time, but over shorter periods of time it caused wide swings in prices related to changes in demand or supply of gold. So I don't think it's a panacea," Bernanke told DeMint.

Additionally, Bernanke said there were a number of practical issues that would prevent the return of gold as the world standard. Namely, there's not enough gold in the world to effectively support the U.S. money supply.
"I don't think that a full-fledged gold standard would be practical at this point," Bernanke said, declining to opine on the gold-backed bond issue because he was not familiar with the idea.
Sen. Mark Kirk, R-Ill., also engaged Bernanke on the currency issue, questioning whether the Fed's $600 billion bond-purchase program is in effect monetizing the U.S. debt. Bernanke noted that the U.S couldn't have currency outstanding if there were no Treasury securities to back it up, and that even the most steady economic times the Fed engages in the buying and selling of U.S.-backed securities.
Kirk, however, noted that the United States did have currency not backed by federal debt at one time in its history: under the administration of President Andrew Jackson, the nation's seventh president.
Bernanke, appearing amused, was quick to respond.
"So this was before the Civil War. This was during the period where individual banks issued currency. We didn't have a national currency," Bernanke said.
Not to be outdone, Kirk asked whether it was possible for a country to have a currency without a trillion-dollar debt. Bernanke said that was the case"


I am obviously not as smart as this guy but i have to say, ARE YOU FOR REAL!


Dollar Index

The dollar is dangerously close to falling to the 70 level, and of course it wont tank overnight,  or will it. In 08 it was the financial or bank crisis, debt crisis?? I don't think current support at this level will hold. Metals and commodities are going to be a great place to be IMHO.

Without a doubt, things have changed

The market character is changing, the dips that are bought are beginning to fail. This reminds me of November 07 when the market topped out. I think the macro problems known to market participants are finally trumping QE to infinity.

The problems in North Africa are not going to go away so quickly. These people have been stifled for far too long, in some cases, hundreds of years of knowing their place so to speak, now are revolting. The class system in these nations is finally under attack. I think its hard for people who grow up in the US to understand what exactly is happening overseas. These are the common people finally speaking up. They have always been denied this right. The right all Americans have and sometimes take for granted. In anycase i think if something took so long to get started its not going to go away unless they snuff it out like in past times, but I don't see this happening, not now, This is HUGE! What is bizarre though, the dollar is down again, in times of turmoil, do people buy the dollar, nope, not now, they are buying gold and silver!!

Metals, Ag, Energy Update

Will the fourth attempt at old highs fail or do we break out. To me it looks like  a perfect set up for a breakout given the political back drop in North Africa. OI at the comex is rising it rose yesterday by over 3800 contracts, and there was some short covering by the banksters. But Silver is where the real action is! 
The collective short position of all the banks is around 7 billion oz. This is made up of 4 billion oz in forwards which is the actual borrowing of metal and selling it forward, and 3 billion oz of naked calls against non existent silver. The Shorts are getting hammered, wonder when they will start running for the hills. We havent had a high volume day, blow-off day. I have been trimming my SLV position out of fear, but I like it that I am uncomfortable at these levels. Waiting for that big day with price and volume spike to sell half of my positions.


Ag stocks out performing SPX during sell-off

Energy Stocks have been superstars in this run, feels like 08

Picked this up again last week, sometimes you just have a feel for a stock and I don't know why but i am in tune with this one, see previous post. The secular bull in Uranium miners continues, but other than CCJ, you can't just hold these I think cause they are like bottle rockets, they fly and sizzle and it can be scary to not lock in gains. I think as before this goes to 7 or higher. This next leg should take it there.

SPX Recap: Character Change

This markets behavior is changing, for a long time now dips were bought and would take out the losses of two or three sessions and now, two days of gains getting wiped out quickly. Little support 1295, looking to test 50dma. I put on a short (SPX) into after the 20dma was breached,holding loosely. 


The futures are stable at the moment after yesterday drubbing, Saudi market was down, and there economic reports pending. 


Yesterday morning it looked as though the bulls were going to try and keep things going on the back of solid manufacturing data (PMI's) out of Europe. However, with oil prices rising and word that Saudi Arabia is sending tanks to Bahrain(note that Saudi Arabia's stock market fell -7%), the early excitement tapered off as the open approached. We didn't have any big economic data to review before the open but we received reports on Construction Spending and the U.S. ISM Manufacturing Index at 10:00 am.

The session began with a significant gap higher but quickly put the high of the day on the chart just three minutes after the opening bell. There were significant bounces around 10:30 and 12:30 but the tape this day belonged to the bears as buyers just never showed up to rescue the tape.


Since February 22nd we've seen a character change within the market. Five of those six sessions had an early morning highs followed by lows in the afternoon. This is markedly different than the weeks prior when the lows were in the morning and closes were near the highs. The early morning highs are a bearish characteristic just as the late afternoon highs were a bullish characteristic.


For the SPX Index there were 36 components advancing and 448 components declining. On the NYSE 3,151 issues were traded with 741 advancing issues and 2,339 retreating issues, a ratio of 3.16 to one declining. There were 190 new highs and 17 new lows. The five day moving average of New Highs is 213 while the five day moving average of New Lows is 18 and the ten day moving average of Net Advancing is 37.


The largest spike in volume came today on the mid-afternoon down move. Rally attempts generated almost nothing of a volume spike. Checking the Breadth Indicators shows mostly pretty bearish looking indicators. But McClellan's Oscillator has a lot of room to go before reaching oversold, suggesting we could easily have another day of selling before seeing much of a bounce attempt.


The negative breadth was stunning. Days such as this often lead to a bounce but this one may go lower before bouncing. Looks like were probably going to test the 50dma or the recent low 1295.


Sectors on the Move:
Sectors stronger than the SPX for Tuesday:
- Consumer Staples -- Outperformed the SPX by +81%.
- Utilities -- Outperformed the SPX by +57%.
- Health Care -- Outperformed the SPX by +76%.

Sectors weaker than the SPX for Tuesday:
- Basic Materials -- Underperformed the SPX by -91%.
- Energy -- Underperformed the SPX by -30%.
- Financials -- Underperformed the SPX by -49%.
- Industrials -- Underperformed the SPX by -53%.
- Technology -- Underperformed the SPX by -33%.
- Consumer Discretionary -- Underperformed the SPX by -32%.


Monday, February 28, 2011

Metals Update

As you probably know silver was raided by the banks on Thursday and then recovered all its losses on Friday. I have been going through the net to find out what happened but still don't know for sure. There are theories out there about JPM & HSBC and smaller players they control did the raid to scare out the new comers and weak hands. They have billions in funny money to play their games and this manipulation will continue. Frankly while this was happening I did have to reach for a depends (the pad, Full Disclosure), and a sub-lingual nitro, not kidding, that was scary.


The other theory is that the longs had enough and were rolling over, or that cash settlements occurred. in any case on Friday we saw a decline in OI by 4952 contracts to 136,560 from 141,512. Although it is clear that the target of the raid was silver, this was a big drop in the OI in Silver.

So why then is Silver will holding up, you washed out the weak hands, amazingly physical buyers just piled right the very next chance they could. Makes me think that some cash settlements occurred on Thursday. This would be risky to the banksters because the guys that settled could come into the market by buying a March contract.


 Maybe that is why the open interest declined by such a wide margin versus gold who endured the same raid.

Of course, all eyes were focused on the front March contract. The open interest for March declined from 28,275 to 14,259 pretty close to what I thought. My guess is that the OI for Monday will turn out to be around 8000 or 40 million oz. Let us wait and see.

The estimated volume on Friday was a huge 102,404 contracts. The confirmed volume on Thursday was a monstrous 140,409. Totally unbelievable. In oz this represents 700 million oz of silver or 1 years annual production if you include China production or 115% of annual production ex China. 


Gold: Gold has been stable has had a nice bounce of the 150dma and is on a steady climb to 1520's, despite a long and steady assault by the paper shorts on gold, they cannot keep it down. Gold maybe setting up for a coiled spring like move once the pressure is reduced.

And I do have to remind my self when my a$% is being handed to me by JPM et al, that nothing has improved in the world since this move in metals started in fact things are much worse politically and economically, and there is no end to the money printing in Europe, US, and Japan. Bottom line the Macro picture is much worse. The secular bull market in metals is alive and well!!!

Friday Market Recap

50dma has been defended nicely by bulls!


Prior to Friday’s open, foreign markets were up for the most part after the Saudi's said they would boosting oil production to nine million barrels/day. The oil futures were higher still, but they had been up $5 more over the past 24 hours. The market was primed to open higher. The government’s first revision of the nation’s fourth quarter GDP showed the economy grew at an annualized rate of +2.8% during the quarter. This was below the consensus expectations for a growth rate of +3.3% as well as the first estimate of +3.2% but still above the Q3 rate of 2.6%. Consumer spending came in at a rate of +4.1%, which was 0.3% below the first estimate’s level. 


Intra-day

The Friday session began with a significant gap higher. There were several waves upward but the only real pullback came just before noon as the SPX pulled back a bit more than three points. But for the bears, that was really the only play of the day as the rest of the session belonged to the bulls. The session closed near the highs for the day but the fourteen point rally for the SPX seemed rather tame after the three down days. Still, small caps and financials rallied hard on Friday.

The SPX lost 23.13 points during the week. The range for the week was 44.65 points, 3.33%. The four week RSI of the four indices (SPX, Dow, NASDAQ, and Russell 2000) is 61. Pullbacks often occur as this RSI reaches 80 and bounces near 20.


Total tick for the week was -53,000. On the NYSE, the advance/decline line declined during the week by 1,177 and the 10 day average of Net Advancing decreased from 528 to 268. There were 411 New Highs and 71 New Lows.

Despite three down days out of four the ten day Net Advancing remains bullish and New Highs outnumbered New Lows six to one.


For the SPX Index there were 432 components advancing and 52 components declining. On the NYSE 3,132 issues were traded with 2,478 advancing issues and 587 retreating issues, a ratio of 4.22 to one advancing. There were 135 new highs and 12 new lows. The five day moving average of New Highs is 235 while the five day moving average of New Lows is 16 and the ten day moving average of Net Advancing is 268. The Net Advancing data indicates a bullish trend.

Advancing volume was higher at a ratio of 6.16 to one. The closing TRIN was 0.69 and the final tick was 277. The five day average of TRIN is 1.21 and the ten day average of TRIN is 1.07. The NYSE Composite Index gained 1.23% today while the SPX gained 1.04%.

For the NYSE, relative to the previous 30 session average, volume was -9.62% below the average. Of the last 15 sessions 5 sessions ended with volume greater than the previous rolling 30 day average volume. Of the last 30 sessions, 21 sessions ended on a positive tick, 6 of last 10. For the SPX, the day's volume was 85.2% of the average daily volume for the last year. Volume was 82.9% of the last 10 day averageand 72.9% of the previous day’s volume.

Breadth was outstanding on Friday but volume was light. In a normal market this is not too encouraging for the bulls but as I have written before RULES HAVE CHANGED FOR NOW, ONLY QE TO INFINITY MATTERS, UNTIL IT WON'T.

Sectors stronger than the SPX for Friday:
- Basic Materials -- Outperformed the SPX by +41%.
- Energy -- Outperformed the SPX by +41%.
- Financials -- Outperformed the SPX by +38%.
- Technology -- Outperformed the SPX by +19%.

Sectors weaker than the SPX for Friday:
- Industrials -- Underperformed the SPX by -16%.
- Consumer Staples -- Underperformed the SPX by -55%.
- Utilities -- Underperformed the SPX by -50%.
- Health Care -- Underperformed the SPX by -28%.
- Consumer Discretionary -- Underperformed the SPX by -3%.


Week of February 28 - March 04 OverviewDate/Time Release/Consensus02/28/11 8:30 Personal Income/0.003
02/28/11 8:30 Personal Spending/0.004
02/28/11 8:30 PCE Prices - Core/0.001
02/28/11 9:45 Chicago PMI/67.5
02/28/11 10:00 Pending Home Sales/-0.032
03/01/11 10:00 Construction Spending/-0.006
03/01/11 10:00 ISM Index
03/01/11 15:00 Auto Sales/NA
03/01/11 15:00 Truck Sales/NA
03/02/11 7:00 MBA Mortgage Index/NA
03/02/11 7:30 Challenger Job Cuts/NA
03/02/11 8:15 ADP Employment Change/163K
03/02/11 10:30 Crude Inventories/NA
03/02/11 14:00 Fed's Beige Book
03/03/11 8:30 Initial Claims/400K
03/03/11 8:30 Continuing Claims/3800K
03/03/11 8:30 Productivity-Rev./0.023
03/03/11 8:30 Unit Labor Costs - Revised/-0.003
03/03/11 10:00 ISM Services/59
03/04/11 8:30 Nonfarm Payrolls/180K
03/04/11 8:30 Nonfarm Private Payrolls/193K
03/04/11 8:30 Unemployment Rate/0.091
03/04/11 8:30 Average Workweek/34.3
03/04/11 8:30 Hourly Earnings/0.002
03/04/11 10:00 Factory Orders/0.021