Friday, April 01, 2011

INXX: Indian Infrastructure ETF


Ever been to India, I have you'll find Cars, trucks, buses, motorcycles, taxis, rickshaws, cows, donkeys, and dogs fighting for every inch of the roadway as horns blare and brakes squeal. Drivers run red lights and jam their vehicles into any available space, paying no mind to pedestrians clustered desperately on median strips like shipwrecked sailors.

India's high-tech services industry has set the country's economy booming. Growth is running at 9%-plus this year. The likes of Wal-Mart (WMT) Vodafone (VOD), and Citigroup (C) are placing multibillion-dollar bets on the country, lured by its 300 million-strong middle class. In spite of a recent drop, the Bombay stock exchange's benchmark Sensex index is still up almost 100%, in the last 5 years.

But this economic boom is being built on the shakiest of foundations. Highways, modern bridges, world-class airports, reliable power, and clean water are in desperately short supply. And what's already there is literally crumbling under the weight of progress. The bridges are in disrepair, highways are deathtraps, people hanging off trains. Economic losses from congestion and poor roads alone are as high as $6 billion a year, says Gajendra Haldea, an adviser to the federal Planning Commission.

The infrastructure deficit is so critical that it could prevent India from achieving the prosperity that finally seems to be within its grasp. Without reliable power and water and a modern transportation network, the chasm between India's moneyed elite and its 800 million poor will continue to widen, potentially destabilizing the country. Jagdish N. Bhagwati, a professor at Columbia University, figures gross domestic product growth would run two percentage points higher if the country had decent roads, railways, and power. "We're bursting at the seams," says Kamal Nath, India's Commerce & Industry Minister. Without better infrastructure, "we can't continue with the growth rates we have had."


India today is about where China was a decade ago. Back then, China's economy was shifting into overdrive, but its roads and power grid weren't up to the task. So Beijing launched a massive upgrade initiative, building more than 25,000 miles of expressways that now crisscross the country and are as good as the best roads in the U.S. or Europe. India, by contrast, has just 3,700 miles of such highways. It's no wonder that when foreign companies weigh putting new plants in China vs. India to produce global exports, China more often wins out.


CAVEAT: India's government has legacy of bureaucracy, politics, and corruption! 

BUT IT CAN BE DONE

PROOF: Politicians who refuse to play the game, N. Chandrababu Naidu, the former chief minister of the state of Andhra Pradesh, transformed the state capital of Hyderabad from a boon-dock, into a high-tech destination by building new roads, widening others, and aggressively carving out land for factories and office parks. Google (GOOG), IBM (IBM ), Microsoft (MSFT ), and Motorola (MOT) have all built R&D facilities there.


As always, do your own homework. I'm buying INXX (Holdings) on any pullback.

KING DOLLAR


Recently Federal Reserve members have come out in favor of tightening US monetary policy and scaling back the Fed’s $600B quantitative easing program. Today’s non-farm payrolls report could go a long way to convince additional Fedmembers that the time has come to begin the normalization of monetary policy. This would ultimately lead to dollar strength, but more vocal support will ultimately be needed.

There have been multiple instances of Federal Reserve members publicly declaring their support for the reigning in of US monetary policy which in turn boosts the dollar.

St. Louis Federal Reserve Bank President James Bullard has said the Fed should review its program of quantitative easing in light of recent positive economic data as the US economy, “Is looking pretty good.” Bullard, who does not have a vote on the Federal Reserve Open Market Committee said during the upcoming April meeting, the Fed may reexamine its decision to purchase $600B in US government bonds in order to lower US interest rates further and support the economic recovery.

Bullard continued his vocal support for tightening of monetary policy in regards to QE II, “The economy is stronger and inflation is higher than when we did the decision,” Bullard said. “So why aren’t you adjusting policy? If you are not adjusting, you don’t have a state-contingent policy. It would be an important signal to send.”

Philadelphia Federal Reserve Bank President Charles Plosser proposed a strategy of raising interest rates and reducing the Fed’s balance sheet on which it holds billions of dollars of US treasuries and other bonds. Plosser also does not have a vote on the Federal Reserve Open Market Committee

Minneapolis Fed President Narayana Kocherlakota helped to boost the dollar when he commented to the Wall Street Journal that the fed funds rate could rise by 75 bp by the end of 2011. Kocherlakota is considered an inflation hawk and is a voting member on the Federal Open Market Committee.

Further speeches by Charles Plosser and New York Fed President William Dudley may also have an impact on the dollar (NOT!). Dudley who does have a vote on the FOMC is considered an inflationary dove (LOL).

LETS SEE WHAT ALL THE TALK HAS DONE FOR THE DOLLAR, NOTHING

WE WON"T GET FOOLED AGAIN!!


Credit Rating Agencies: What A Joke!

Rating Agencies cartoons image illustration picture


Link: WHO CARES!


Rating agencies should have been abolished after what happened in Iceland 07, after they gave the three banks AAA ratings and three months later they imploded, not to mention what happened in 08.


Metals Update

Gold closed today up $15.10 to $1438.90. The price of silver closed at a 31 year high at $37.87 up 37 cents.

But right after the Comex close, the banksters knocked gold and silver down, there were six attempts to take prices down, the selling was sharp but inevitably ineffective. Both Gold and silver are up slightly right now. Despite the rise in God OI fell as Banksters took some shorts off the table. And the OI in Silver dropped a bit as well.

As you may have read in my earlier posts that gold has printed an inverse HNS pattern and is trying to break out, near term target 1540. Silver is right up against resistance, I was call for 40 my end of March missed it by two bucks, silver is stuck in a range. Major Support is at 36.5, resistance at 38. If you are really nimble you can trade it.

Both are headed much higher, you know how I know. Are we increasing or decreasing spending (Govt.), is the national debt situation improving, are the prices of things going up or down, how does North Africa and the Middle East look, are we out of Afghanistan and Iraq. How does the dollar look?


I'll start to get worried IF and WHEN that changes and at some point it will.

In Honor of the Faux Non-Farm Payroll


S&P 500 Recap and A Look Inside the Markets

Good morning. Nasdaq is teaming up with Intercontinental Exchange to make an approximately $11.3 billion counteroffer for the parent of the New York Stock Exchange.

China's manufacturing sector was strong in March, easing fears of a sharp slowdown, on demand for autos and machinery, according to surveys released this morning.

S&P Futures are up a little as I write, and gold and silver are down after an impressive performance by Gold yesterday, as it out performed silver for the first time in months. 


Oil prices rose above $107 a barrel as worries of prolonged civil conflict in Libya will keep the OPEC nation's crude exports off the market longer than expected.

Yesterday's session began without a significant gap and then tried to move higher before selling four points before 10:00 am. But the session was determined to trade in a tight range and quickly bounced to recover the four points. This began an intra-day pattern of ping-pong between 1326 and 1330. The entire session traded within less than a five point range and closed at about 20% of the intra-day range. I'm seeing heavier volume in declining stocks when compared to advancing issues in the S&P, i continue to warn of this!. Today's overall volume was light as traders were willing to simply wait for tomorrow's economic data, mainly the fake Non-Farm Payroll report. 


6.2% of the SPX are above their five day moving average, 84.8% are above their 10 day average, 81.2% are above their 20 day moving average, 68.6% are above their 50 day moving average, and 87.2% are above their 200 day moving average.

One significant moving average crossover today as Emerging Markets 20 DMA crossed above the 100 DMA. But check out the top part of chart and see how most of the moving averages are on the rise and how strong the moving averages for the Russell 2000 look. 


Please note: The emerging markets have significanly underperformed the US, but there seems to be a divergence from that theme now, take a look at EEM, EPU, IFN for entry, and I will have something on the CEE. The Central and Eastern European ETF has outperformed the S&P in the last few months and is up 15% since last October. 


As you know I went long BGZ a couple of days ago (yes, once again!) so I am not bullish on S&P or US equities but it doesn't mean I wont go long other markets. I'm not sure if the decline in the US equities will take say stocks in Peru down. Just look at Peru last summer, as the S&P was declining EPU was ramping up and there are other examples. I'll put some charts up later.


Long: BGZ until 1333 gets taken out handily, TBT, AGQ, XLE, DBA, URA (sm. miners), JOF, POT, AGU, HAL, TTM, TKRFF


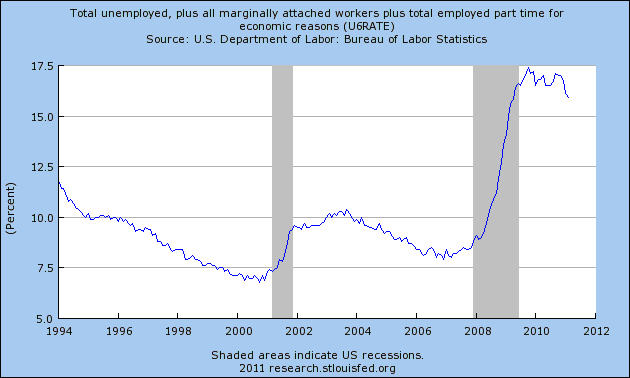
Current Real Unemployment is 16%

Still waiting for change. by Eckstein, Bob
Good Morning, in my daily reading I came across this link posted on Harvey's blog. As I have been saying to anyone who would listen we are living in a time of exaggerated deception or perhaps I'm naive and its been same throughout history of this nation. 

When I was growing up we had just CBS, NBC and ABC and of course the newspapers. So we had only those voices, and their freedom of expression that was the only way to communicate effectively to the masses. Now via, the net (Blogs) "We the people have a voice", a very loud one at that.  And we need not gather in the streets, but share thoughts right here. 

Do not be confused by the disinformation being fed to you: DON'T GET FOOLED AGAIN!

TECH BUBBLE, HOUSING BUBBLE, SUB-PRIME, FINANCIAL CRISIS: Brought to you by the FED (cartoon shows you in a light-hearted how the central banks came to be and how they control government)

 "If the American people ever allow private banks to control the issue of their currency, first by inflation, then by deflation, the banks and corporations that will grow up around them will deprive the people of all property until their children wake up homeless on the continent their Fathers conquered...I believe that banking institutions are more dangerous to our liberties than standing armies... The issuing power should be taken from the banks and restored to the people, to whom it properly belongs."~Thomas Jefferson


Brilliant post by, Jeff Nielson (www.bullionbullscanada.com) : 

It becomes more and more difficult to discuss U.S. employment "statistics", since an ever greater percentage of what is presented is simply total fabrication. The U.S. Bureau of Labor Statistics (BLS) might as well abbreviate its name to "Bureau of LieS", as none of the reports it produces bear any resemblance to the real world.To this mountain of fiction we can now add the "ADP" monthly-payrolls report. This statistic is supposed to be beyond manipulation, as its data-stream comes directly from the payrolls of U.S. employers. However, look at "the fine print" and we will see that its report represents the data of less than 1/6th of total employment.
When their reporting excludes 85% of the U.S. economy, it obviously becomes very easy to "stack the deck". As an easy example: the U.S. is (still) embroiled in two (and now three?) "wars". With the biggest war-machine in the history of the world, certainly more than 1/6th of the U.S. economy is devoted to simply servicing that war-machine.
Thus all that ADP Employment Services needed to do to create a "U.S. economic recovery" is to focus its reporting on U.S. companies which derive a substantial part of their revenues from the U.S. military - a very long list. Having established that this data-stream could have easily been skewed to the point of total irrelevance, the question then becomes: is there evidence of such fabrication?
Fortunately, there remain a few niches of data reporting in the U.S. economy which have not yet been completely "sterilized" by the U.S. government's propaganda-machine. When such data is depicted in the form of long-term charts, those charts paint an irrefutable picture of an economy mired not merely in a "recession", but one which is clearly experiencing a depression.
Let's start with the one measurement of the U.S. unemployment rate which is still in the same ballpark as real-world numbers: the "U6" measurement.


First let's look at the overall level. Current U.S. unemployment is about 16% - nearly double what the U.S. government pretends it to be. Note the tiny improvement from the worst level. The roughly 1% decline in this rate takes it back to where it was when the U.S. government claimed that the U.S. economy had "hit bottom".
Let me reiterate this: after two years of a supposed "economic recovery", even using the U.S. government's own data, we see that the unemployment rate has merely equaled the rate at the "bottom" of the so-called recession. Two years of supposed "job creation" has brought the U.S. economy to the same point it was at the so-called "bottom". Using the U.S. government's own data, there clearly never was a "recovery".
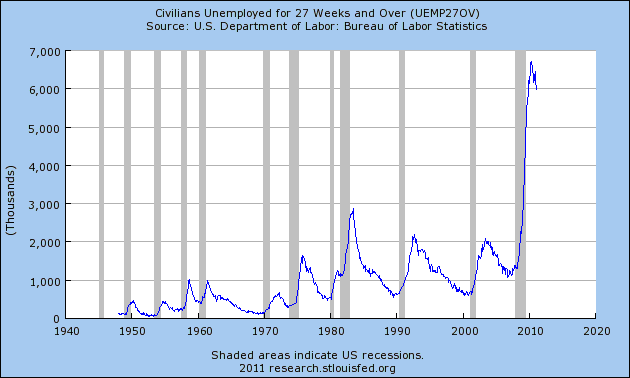
Let's move on to a few more pictures on U.S. employment/unemployment. If we look at "long-term unemployment" in the U.S., we see a chart much like the "U6" unemployment rate.


After two years of a supposed "economic recovery", we see U.S. long-term unemployment much, much worse than at any time since the Great Depression - and no indication of any "recovery".
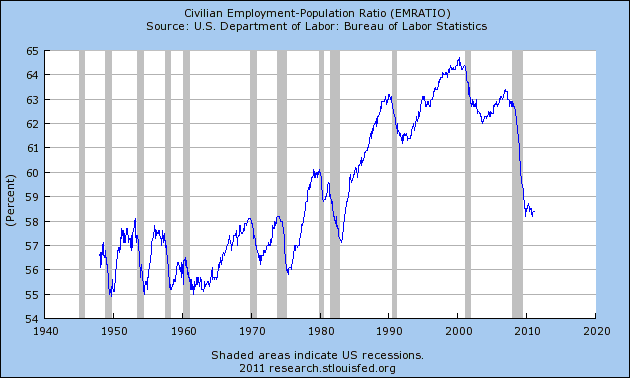
Equally revealing is a chart on the employment "participation rate" among the U.S. population. As with all Western countries, we see a large climb in this figure which began moving significantly higher in the 1970's, reflecting the integration of large numbers of female workers into our economies.


As with many U.S. economic charts, this one "fell off a cliff" when the U.S. Greater Depression began in 2008, and despite two years of an "economic recovery", there has been absolutely no recovery. Participation rates have reverted to what was seen in the U.S. prior to the massive increase in female employment. The U.S. now has both genders wanting to work in an economy which is only supplying enough jobs for one gender.


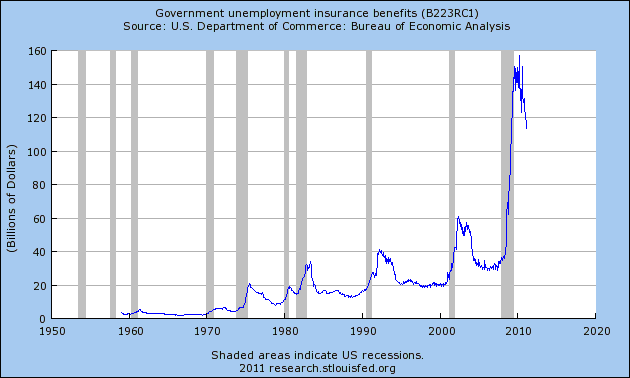
The last of these employment charts shows the massive spike in the payment of unemployment benefits. Again we see a chart which duplicates the pattern seen in the other charts, but which is derived from a totally separate data-stream. The modest "improvement" here is derived solely from the expiration of benefits, and not from rising employment levels - and even after this "improvement", payment levels are worse than at any time in the U.S. in recorded history.
The only conclusion which can be drawn from the clear picture presented in these charts is that there has never been any "U.S. economic recovery", meaning that the ADP payroll-reports have become nothing but totally fictitious government propaganda (much like the BLS B.S.).
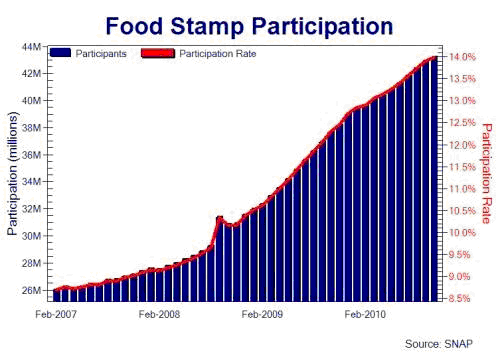
Naturally there will remain a large number of trusting 'sheep' out there, who steadfastly believe that their government would never lie to them, and thus are convinced I must be "cherry picking" my numbers in some sort of devious manner. My apologies to readers who have already seen the following chart a few times, but it provides the clearest picture of all.


As I pointed out previously, the tiny little "blip" indicates roughly when the U.S. government claims that the U.S. economy bottomed, while the steady climb in food stamp-usage since that time reflects the supposed "economic recovery". As with all of the employment charts, it is obvious that such a recovery never took place.
Like "The Boy Who Cried Wolf", the U.S. government has been lying about its employment data so much for so long, that even in the unlikely event that the U.S. economy did actually begin to produce positive employment gains, it's unlikely that any thinking adult will believe it.
The U.S. economy is mired in a worsening depression. Yet what is even more depressing is that the only "solution" which the U.S. government has come up with to deal with this economic catastrophe is to tell larger and larger lies. As the chart on food stamps clearly demonstrates, those lies are not putting food on the table for Americans.


Thursday, March 31, 2011

Wal-Mart CEO: Sees Big time inflation coming/It's already here!


Bernanke And Inflation Cartoons Allvoices 609x609

Inflation is "going to be serious," Wal-Mart U.S. CEO Bill Simon said during a meeting with USA TODAY's editorial board. "We're seeing cost increases starting to come through at a pretty rapid rate."

Radiation reaches US from Fukushima

Low levels of radiation has been found in milk from Washington State. Both The Environmental Protection Agency and Food and Drug Administration have indicated that the doses are low enough that they should not cause consumers to worry. Both agencies said that these findings were to be expected as a result of the radiation cloud secondary to the Japanese nuclear crisis. They also indicated that the problem should go away just as quickly as it appeared. Both agencies are continuing to monitor water, precipitation and agriculture.

As I'm telling my family and friends do not buy Seafood from the Gulf and Milk and agricultural products from the North Western United States. Paranoid, no not really! EPA, FDA work for the  Agri-business lobbyists not for us. They won't want to panic the masses and I don't either, use your head. If you can live without just don't buy it (order it) until the dust settles (no pun intended).

TKRFF: Tinka Resources

I have to give credit to Mr. Silvergoldsilver for this one. I had nothing to do with this pick and I have never bought a penny stock before so I bought a small amount over a two to three week period. The guy says its going to 1.50. I don't know if it is but i'm up 33% already and this thing keeps wanting to go higher.

See the little bull flag!!

There is a nice write up on the company, and as always do your own homework!! 

Debt is a Killer, NO, I MEAN LITERALLY!!

A man was killed by a Citibank employee in Jakarta for arguing his CC bill.


Full Story

PLAY BALL !!!


Yankees open against Detroit and its a beginning of another beautiful season. Time to start hating on the RED SOX and time to stop worrying about the USD, Debt Crisis, The Ben Bernak, and The JP Morgue, the Banksters, the CRIMEX, if only for just a couple of hours a day. PLAY BALL !!!!

INVERSE HNS: GOLD

NOW THAT CRAMER HAS JINXED SILVER GOLD IS SET TO BREAK OUT

I pointed to this inverse HNS pattern developing in Gold a few days ago and that breakout failed, Lets see if we breakdown the resistance wall this time. Target 154 No position in GLD (Gold ETF).

Bill Gross Confident US will default on its Debt


I started writing this blog a few months ago because I got tired of telling family and friends the same thing at different times. So I now say just read the blog and you won't get fooled again! Having been burned by the tech bubble, housing bubble, and 08 financial crisis,\. I was not going to sit quietly while they lead me (my family and friends) down the garden path in this coming debt crisis. Do you think anyone of them are listening, nope (maybe a couple)! Why because the S&P goes up everyday and so everything must be fine, right? 

The fact that America is bankrupt isn't really news to people with political or finance backgrounds, but the most simple hard work people are completely unaware. 


I coach my kids little league team and when the parents get together start talking about politics or issues about the economy, I am amazed that people really have their heads in the sand or they say stuff like, what can we do about it? Ah, protect yourselves your families?

Anyway, here is the latest from PIMCO:

 "I am confident that this country will default on its debt; not in conventional ways, but by picking the pocket of savers via a combination of less observable, yet historically verifiable policies – inflation, currency devaluation and low to negative real interest rates." 


S&P 500: Financials & Tech Lagging

Good morning, things are very quiet this morning. Yesterday overseas markets and futures were green in the early going as NATO chief Anders Rasmussen urged all parties to seek a political solution as soon as possible in Libya. The Japanese crisis appeared all but forgotten by traders.


On the economic front, Challenger reported that Planned Job Cuts fell by 18% during March and that the first quarter totals were the lowest since 1995. ADP reported that the private sector job market expanded again during the month of March. The report shows that private sector jobs rose by 201K jobs during the month, which was just below the consensus expectations for a gain of about 204K.


The midweek session began with a five point gap higher and continued a few more points upward before spending an hour in sideways consolidation. But from then until shortly after 1:00 pm when the highs were put on the chart it was all bulls. The afternoon was gentle decline but the absence of sellers held the market up near the highs until the final minutes when some moderate selling hit the tape. 


So checking under the hood we finally got good volume in advancing issues, and the NYSE out performed the SPX as well. On the negative side Tech and Financials were weak and if you look back to when this rally started last summer/fall NAZ100 lead the way. Keep an eye on that. Also I'm hearing that this rally was lead up by copper, and copper and S&P are parting ways so it maybe the canary in the coal mine. 


Looking inside the numbers we see in the S&P 371 components advancing and 106 components declining. On the NYSE 3,149 issues were traded with 2,226 advancing issues and 828 retreating issues, a ratio of 2.69 to one advancing. There were 263 new highs and 12 new lows. The five day moving average of New Highs is 167 while the five day moving average of New Lows is 12 and the ten day moving average of Net Advancing is 837. The Net Advancing data indicates a bullish trend.


Advancing volume was higher at a ratio of 3.33 to one. The closing TRIN was 0.85 and the final tick was 553. The five day average of TRIN is .93 and the ten day average of TRIN is 1.16. The NYSE Composite Index gained 0.85% today while the SPX gained 0.66%.

For the NYSE, relative to the previous 30 session average, volume was -13.25% below the average. Of the last 15 sessions 4 sessions ended with volume greater than the previous rolling 30 day average volume. Of the last 30 sessions, 20 sessions ended on a positive tick, 7 of last 10. For the SPX, the day's volume was 86.3% of the average daily volume for the last year. Volume was 89.4% of the last 10 day average and 111.4% of the previous day’s volume.

Total tick for the day was 237,000 and the average tick for the day was 153. There were 48 ticks greater than 600 and 3 ticks more extreme than -600. There were no ticks greater than 1000 and no ticks more extreme than -1000. The tick action suggests institutional accumulation.

Today's volume was heavier than Tuesday. Most significant intraday were spikes in volume with SPX up moves and a general decline in volume during the afternoon. Looking at the Breadth Indicators, things are not quite as bullish as yesterday. The New High/New Low ratios are showing some cracks and that may mean a pullback is coming. And as I mentioned yesterday we are right up against major resistance so this really isn't a good time to make new buys.


Wednesday, March 30, 2011

OWEbama Authorizes Covert Action In Libya

Reuters: OBAMA HAS SIGNED SECRET ORDER AUTHORIZING COVERT U.S. GOVERNMENT SUPPORT FOR REBEL FORCES IN LIBYA, OFFICIALS TELL REUTERS

This Could Be A Really Bad Omen

SAY IT AIN'T SO

This could be potentially really really bad, JC (no not the real JC) but Jimmy Cramerica, is bullish on Silver, Yikes!! Silver has had an amazing run, and the most widely-followed market pundit is on board.
In this video, he urges people to buy physical, and expects that as long as retail folks like silver, the price will go up.
One great point that he makes is that if you try to buy some physical silver at any coin or bullion dealer, you'll see that the spot "market" price is a joke, and that people are willing to pay a lot more.


Read more: http://www.businessinsider.com/jim-cramer-buy-physical-silver-2011-3#ixzz1I77Rmv8K

http://www.businessinsider.com/jim-cramer-buy-physical-silver-2011-3

S&P Currently Overvalued

CREDIT: HEDGEYE.COM 


Conclusion: Based on Shiller’s CAPE P/E multiple, the market is at least one standard deviation overvalued. Further, corporate margins are at 30-year highs, which suggest it is unlikely that earnings will grow into their multiple.

In the chart directly below, we’ve highlighted Professor Robert Shiller’s (our neighbor across the street at Yale’s School of Management) long term Cyclically Adjusted P/E chart for the SP500. Over time, the valuation of the U.S. stock market has varied widely. Based on Professor Shiller’s work, the lowest P/E multiple for the broad market was 4.8x in December 1920, while the highest P/E multiple came in December 1999 at 44.2x.


Currently, the valuation according to Shiller’s analysis is 23.6x earnings, which is well above the long run average of 16.4x. In fact, the current valuation of SP500 composite is more than one standard deviation above its long run average. So, while this is not necessarily an extreme overvaluation, the market is clearly not cheap on this basis. The chart above shows this well graphically, as valuation is just starting to breakout above its historical range.

By way of background, Professor Shiller uses what is called CAPE, or Cyclically Adjusted Price to Earnings. In terms of the numerator, or price, Shiller uses the monthly average of daily closes for the SP500. To derive the earnings data, in this instance the denominator, Professor Shiller uses the quarterly earnings data from the SP500’s website and utilizes an interpolation to provide earnings data by month. He then adjusts both the numerator and denominator for inflation using CPI from the Bureau of Labor Statistics. Finally, the inflation adjusted price is divided by an average of ten years of real monthly earnings to determine the CAPE.


Obviously, market valuation is one of many factors to consider, but certainly the stock market is not cheap. The key push back on this call out is that future earnings growth will drive the overall P/E of the market lower, so perhaps the market is not as expensive as it appears. Our key issue with the earnings growth argument is based on slower than expected GDP growth both domestically and abroad and a limited ability of corporations to expand margins.

On the second point related to corporate margins, profit margins in the United States are at near all-time highs on various calculations. In fact, as highlighted in the chart below, our calculations using BEA data show that both EBITDA and EBIT margins are at/near 30-year highs. Needless to say, the margin expansion argument is somewhat difficult to make given that backdrop and the potential for mean reversion.


original source

So much for the raid

Silver fell off a cliff and is right back up near the highs, this is incredible!!! 
Dont know what to make of it but I do not trust the over night, the FED and its banking Cartel don't want us hedging inflation/weak jobs number etc. They want us out of metals. Be very careful out there, Blythe hasn't been spotted lately but she is out there waiting for us to get comfy cozy with our positions. Long AGQ and ZSL (Hedge as of this am). 

Right at Major Resistance


GOING LONG BGZ RIGHT HERE bought @35.36, sell stop 34.85

Did you know A Monkey Could Ruin A Once Great Nation

This was one SPECIAL FREAKIN MONKEY

Thanks for the Tech Bubble and The Housing bubble and the Greatest Financial Crisis of all time...


The Exceptional Mr. Greenspan

Alan Greenspan continues his efforts to cement his reputation as the worst ex-Fed chairman in history; in today’s FT, he comes out for a repeal of financial regulations designed to prevent a repeat of the crisis for which he, more than any other individual, bears personal responsibility.
To be honest, I didn’t know quite how to respond; I was, very nearly, left speechless by the lack of self-awareness on display. But Henry Farrell shows us the way, pointing out that Greenspan’s piece contains this remarkable passage:
Today’s competitive markets, whether we seek to recognise it or not, are driven by an international version of Adam Smith’s “invisible hand” that is unredeemably opaque. With notably rare exceptions (2008, for example), the global “invisible hand” has created relatively stable exchange rates, interest rates, prices, and wage rates.
Henry then asks readers to chime in with other uses of the “with notably rate exceptions” phrase. 

http://krugman.blogs.nytimes.com/2011/03/30/the-exceptional-mr-greenspan/?smid=tw-NytimesKrugman&seid=auto

In the absence of the gold standard, there is no way to protect savings from confiscation through inflation. There is no safe store of value.
Alan Greenspan

The Raid in Metals is ON!!!

Where is Jamie Dimon
I spoke about a raid coming, I thought they would wait until 130pm or so, but the Banksters are at it  early. I took some AGQ's off at the open, put in a bid at 210 and 200, I don't think we will go much lower than 36.5 on the PM (Physical Metal) of price, there is strong support there.


The American Dream (Home Ownership)


In a note today, BofA/ML analyst Michelle Meyer looks at the state of The American Dream, home-ownership, where it stands now, and where it's going.
Since the housing bust, Americans have begun a shift towards renting, and Meyer predicts a continuation of that trend for three big reasons.
First, there is still a large backlog of foreclosures – as of the end of 2010, there were 4.3 million homeowners in foreclosure or seriously delinquent – which will naturally become renters. And, this is not the end of the pipeline. There are about 3.5 million mortgages that have received a modification, of which at least half are likely to re-default and enter foreclosure. In addition, there are 1.3 million mortgages 60 days delinquent, and although the pace of new delinquencies has slowed, it is still elevated. We believe it is reasonable to expect nearly 8 million foreclosures to enter the market over the next three years. This means we can expect a steady shift into rentals from foreclosures through 2013.
Second, young adults forming new households are not good candidates for homeownership in this market of incredibly tight lending standards and high unemployment. Not only is in difficult to qualify for a mortgage but the down- payment requirement is higher, which means young adults will need to be liquid and willing to lock-up cash. In addition, purchasing a home reduces labor mobility,
Third, the recession has greatly impaired household net worth and lowered income, making it more difficult for current renters to transition to homeowners...


Read more: http://www.businessinsider.com/why-home-ownership-isnt-coming-back-2011-3#ixzz1I5wtjOjZ

OWE-Bama's Plan to Decrease Oil Imports

Rising prices at the pump affect everybody – workers and farmers; truck drivers and restaurant owners.  Businesses see it impact their bottom line.  Families feel the pinch when they fill up their tank.  For Americans already struggling to get by, it makes life that much harder.  That’s why we need to make ourselves more secure and control our energy future by harnessing all of the resources that we have available and embracing a diverse energy portfolio. With an ultimate goal of reducing our dependence on oil, in the near term we must responsibly develop and produce oil and gas at home, while at the same time leveraging cleaner, alternative fuels and increasing efficiency.  And beyond our efforts to reduce our dependence on oil, we must focus on expanding cleaner sources of electricity – keeping America on the cutting edge of clean energy technology so that we can build a 21stcentury clean energy economy and win the future.
Reducing oil imports
In 2008, America imported 11 million barrels of oil a day.  By 2025 – a little over a decade from now – we will have cut that by one-third.
  • Expanding Safe and Responsible Domestic Oil and Gas Development and Production:
    • Implementing critical safety reforms:  In response to the Deepwater Horizon oil spill in the Gulf of Mexico, the Obama Administration has launched rigorous and comprehensive environmental and safety reforms to ensure the responsible development of offshore oil and gas resource
    • Identifying underdeveloped resources:  The President asked the Department of the Interior (DOI) to issue a report on the status of unused oil and gas leases.  That report showed that 57 percent of all leased onshore acres and 70 percent of offshore leased acres are inactive – meaning that they are neither being explored or developed.
    • Developing incentives for expedited development and production: DOI is developing incentives for expedited development of oil and gas production from existing and future leases.  For its offshore leasing program, the DOI has already begun to employ incentives, including the shortening of some lease terms to encourage earlier development, and requiring drilling to begin before an extension can be granted on a lease.  DOI is also evaluating the potential use of graduated royalty rate structures, such as those adopted by the State of Texas, to encourage more rapid production.
  • Securing Access to Diverse and Reliable Sources of Energy:  The U.S. is acting in the international arena to moderate global oil demand and secure additional supplies of liquid fuels and clean energy.  We are working with our international partners to increase natural gas supplies, replace oil with natural gas in power generation, and increase responsible oil production in a manner that ensures safety .  We are also increasing sustainable bioenergy production, building a new international framework for nuclear energy, and promoting energy efficiency.  
  • Developing Alternatives to Oil, Including Biofuels and Natural Gas:  Some of our most effective opportunities to enhance our energy security can be found in our own backyard.  We are committed to finding better and smarter ways to use these abundant energy resources. That means:
    • Expanding biofuels markets and commercializing new biofuels technologies:  Corn ethanol is already making a significant contribution to reducing our oil dependence, but increasing market share will require overcoming infrastructure challenges and commercializing promising cellulosic and advanced biofuels technologies.  To help achieve this goal, the Administration has set a goal of breaking ground on at least four commercial-scale cellulosic or advanced bio-refineries over the next two years. And as we do all of these things, we will look for ways to reform our biofuels incentives to make sure they meet today’s biofuels challenges and save taxpayers money.  
    • Encouraging responsible development practices for natural gas:  The Administration is committed to the use of this important domestic resource, but we must ensure it is developed safely and responsibly. To that end the Administration is focused on increasing transparency about the use of fracking chemicals, working with state regulators to offer technical assistance, and launching a new initiative to tap experts in industry, the environmental community and states to develop recommendations for shale extraction practices that will ensure the protection of public health and the environment. 
  • Cutting Costs at the Pump with More Efficient Cars and Trucks:   The Administration is building on recent investments in advanced vehicles, fuel, technologies, high speed rail, and public transit:
    • Setting historic new fuel economy standards: Standards for model years 2012-16 will raise average fuel economy to 35.5 miles per gallon by 2016, and save 1.8 billion barrels of oil over the lifetime of the vehicles covered. In July, the Administration will also finalize the first-ever national fuel economy and greenhouse gas emission standards for commercial trucks, vans and buses built in 2014 - 2018.  These standards will cut oil use and promote the development and deployment of alternative fuels, including natural gas.  The Administration is also developing the next generation of fuel economy and greenhouse gas emission standards for passenger vehicles 2017-2025 and expects to announce the proposal in September 2011.
    • Paving the way for advanced vehicles:  The President has set an ambitious goal of putting 1 million electric vehicles on the road by 2015.  To help us get there, the President’s FY 2012 Budget proposes a redesigned $7500 tax credit for consumers, competitive grants for communities that encourage the adoption of electric vehicles, and funding for R&D to drive innovation in advanced battery technology.  At the same time, the President is calling on Congress to move forward with policies that can help unlock the promise of natural gas vehicles.
  • Leading by Example With the Federal Fleet.  The Federal government operates more than 600,000 fleet vehicles.   We have already doubled the number of hybrid vehicles in the federal fleet.  Today, the President is calling for administrative action directing agencies to ensure that by 2015, all new vehicles they purchase will be alternative-fuel vehicles, including hybrid and electric vehicles. 
Innovating Our Way to a Clean Energy Future 
Charting a path  towards cleaner sources of electricity and greater energy efficiency, and remaining on the cutting edge of clean energy technology.
  • Creating Markets for Clean Energy:  To move capital off of the sidelines and into the clean energy economy – creating jobs in the process – we need to give businesses and entrepreneurs a clear signal that there will be a market for clean energy innovation.  That’s why the Administration is committed to pursuing a Clean Energy Standard (CES), an ambitious but achievable goal of generating 80 percent of the Nation’s electricity from clean energy sources by 2035 – including renewable energy sources like wind, solar, biomass, and hydropower; nuclear power; efficient natural gas; and clean coal.
  • Cutting Energy Bills through More Efficient Homes and Buildings: Our homes, businesses and factories consume over 70 percent of the energy we use.  By making smart investments in energy efficiency in the residential, commercial, and industrial sectors, we can improve U.S. competitiveness and protect our environment, while saving consumers money on electricity bills.  That is why the Administration is on track to weatherize 600,000 low-income homes through Recovery Act investments, and why we remain committed to a series of policies that increase efficiency across sectors – including a HOMESTAR program to help homeowners finance retrofits, a “Better Buildings Initiative” to make commercial facilities 20 percent more efficient by 2020, and steps to promote industrial energy efficiency.
  • Staying on the Cutting Edge through Clean Energy Research and Development:  Through the Advanced Research Project Agency-Energy (ARPA-E) program, we have invested in over 100 cutting-edge projects in areas ranging from smart grid technology, to carbon capture, to battery technology for electric vehicles. Past Budgets funded three “Energy Innovation Hubs” that explore building efficiency, fuel from sunlight, and nuclear reactor modeling and simulation.  The FY 2012 Budget request more than doubles funding for ARPA-E and doubles the number of Hubs to include new Hubs that will advance smart grid technology, critical materials research, as well as batteries and energy storage.


Adding Halliburton


Oilfield services stocks (OIH) have received a second boost this week as Saudi Aramco, Saudi Arabia's national oil company, signaled an increase in development activity.

OIL SERVICES ETF
Oilfield services leaders Schlumberger (SLB) and Halliburton (HAL) each jumped 4% this Monday after Schlumberger said work disruptions caused by upheaval in North Africa would dent its first-quarter earnings. Investors focused instead on the bullish picture of the industry's prospects painted Monday by Chief Executive Andrew Gould.

A Halliburton release after Monday's market close said the company expects impact of up to 4 cents to first-quarter earnings from geopolitical issues in North Africa.

Halliburton's release also said the company "expects to increase activity in its Manifa project based on discussions with its customer in Saudi Arabia." Halliburton confirmed it had met with Aramco executives last weekend. You can find this info on their website.

The Manifa project, estimated at $11 billion, reportedly calls for 31 artificial drilling islands as well as 13 offshore platforms. Aramco estimates the field's heavy oil reserves at more than 10 billion barrels. Halliburton was contracted in 2008 to perform a wide array of drilling and services on a total of 93 wells.

The company then announced in a Q1 2009 conference call that the project's startup had been deferred.

Halliburton has confirmed Aramco was targeting a 30% increase to its rig count, from around 92 to 118. Growth is expected to increase in the second half and into 2012, he wrote, adding that Schlumberger, Halliburton and Baker Hughes (BHI) have the highest exposure to Aramco. Weatherford International (WFT) also stands to benefit.

Long: HAL (bought at 49.02)

Gold/Silver Ratio: Interesting post by Business Insider

A lot is made of the fact that the silver:gold ratio is very low, and that silver would need to come down a lot (relative to gold) to get back in line with historical ratios.
But usually that discussion looks back a few decades.
Deutsche Bank's Daniel Brebner goes a bit further. Actually a lot further. Actually through the history of time, since the formation of the earth's crust.
  • From the 12th to the 17th century, the gold/silver ratio held reasonably constant at about 12:1.
  • Isaac Newton monetized silver and set the ratio at 15.5 early in the 18th century and this held until 1873.
  • In terms of relative abundance in the earth’s crust, silver exceeds gold by a ratio of about 18.75.
Since the current ratio is in the 30s, silver could rally A LOT more, relative to gold, to get back to old history.