Friday, October 29, 2010

QE2: How to play the game, and make some money!

It is a given that the federal reserve will need to keep on printing money or QE. Their goal (whether it has ever worked or not is irrelevant) is to stimulate credit, promote sustainable employment, and reach their inflation target, all of this with the effort to help economic recovery.

The market is also betting that the QE (or Crack) will continue and thus you are seeing a rising stock prices weakening dollar  and rising silver& gold (and other metals & soft commodities). You aren't hearing much about inflation in the news (the government might not report it) but there are very clear signs of it right now. The CRBA (global agricultural ETF) gained 34 percent during the last quarter, soft commodities such as sugar, and wheat gained 52 percent and 30 percent respectively during the same period. 

The policies adopted by the federal reserve have strong implications for consumers worldwide and  as inflation starts to spread through asset markets this in turn affect consumer prices. There will surely be repercussions in the poorer undeveloped nations, the middle and working classes will be effected. 


As for metals, they will continue to rise as a direct result further money printing by the federal reserve and other central banks, Gold has already risen 9 percent during the last quarter and almost 30 percent for the year (has already risen 4.5 fold since 2000). 

The QE2 program will likely be open ended, without a fixed amount of mortgage backed securities or treasuries to be monetized during an undefined period. The program is set to stop once the federal reserve thinks it's no longer necessary. Fed member James Bullard proposes the program will consist of monthly purchases of 100 billion or less of US government bonds he stated that he would recommend pausing when they reach 1 trillion dollars. 

NOTE: The last QE program did not produce jobs, lower interest rates or promote credit expansion. What it did was weaken the dollar, increased commodity prices, and increased the price of services (trickle down effect). 

Until recently many people who were in the deflation camp they were buying up the treasury bonds hand over fist.  Thats why we had seen bonds and stocks going up at the same time (they are usually move in opposite directions). The bond guys were betting on the no  further easing (for the reasons i mentioned earlier). They also felt that FED would be afraid to cause runaway inflation and or angering homegrown or foreign creditors would would shun the weakening dollar, dump their debt holdings.

RIGHT NOW: Strong bets being made by the inflation camp (which is winning out) and the deflation camp seems to be wavering. We see stocks holding up, yields rising and bonds plummeting. I think this will continue in the long-term (hence blog name SECULAR TRENDS)


In the short-term, I expect to see a pullback beginning next week leading to a buying opportunity. The reasons I feel this is coming is due to technical indicators lining up perfectly, one is that the SPX is right up against the 200wkma, others are the declining volume on up days, a tight extended trading range, too many bulls according to sentiment (AAII 2;1 Bu/Br ratio), and elevated weekly stochastic to name a few. Finally, the markets that lead us up are over extended and have weakened, mainly GLD/SLV, the Emerging Markets (Chile, China, India, Peru). The Nasdaq is up 6% for the past three weeks while the emerging market are flat to down over that time. 


Short term I am long FAZ, BGZ, ZSL, DZZ (Just Hedging)


Long-term(Riding Secular Trends): Long: TBT (SHORT THE LONG BOND), GLD, SLV(SILVER/GOLD  2:1), MOO (agriculture), Urianium (basket of stocks), UNG(Nat Gas as oil will explode higher) , XLE (energy large caps, GDXJ (junior gold miners) and DBA (Soft commodities) 

VIX Going Much Higher


I think VIX is getting ready to go much higher see the move in the stochastic cross, VIX is already up 25% for the week!!

TLT Intraday


Getting support at 150dma

Reaction to GDP

Range Bound, A look inside the market


In the premarket the futures were pointing to a higher open. The Labor Department reported that initial claims for unemployment insurance for the week ending October 23 fell by 21,000 to 434K. The week’s total was 19K below the Reuters consensus for a reading of 453K. Continuing Claims for unemployment for the week ending October 16 were below consensus at 4.356M vs. expectations for 4.426M and last week’s revised (higher again, of course) 4.478M.

SPX opened with a three point gap higher and surged up quickly to put the high on the chart just nine minutes into the session. After 30 minutes of consolidation sellers hit the tape and took the index down seven points followed by another 90 minutes of sideways action. The Lunch hour brought the usual lull and the low of the day was printed at 12:30 pm. Then in typical fashion, bears scurried back to the caves and bulls continued working throughout the afternoon and managed to close the SPX and Nasdaq in positive territory (rumors of a good quarter by Mr. Softee) after spending much of the day in negative ground. 


The deflationistas were out buying bonds pushing yields down and we saw the odd trend again of bonds and stocks going up together. 

Looking at our Market Leaders board this evening, we find plenty of mixed results. Basically, overseas markets were higher, along with technology, and the large caps (SPX and NYSE Composite), while chip makers (SMH putting in a short-term top), Dow and small caps were weaker.


The dollar was slammed today (PRINT & SPEND BABY) while earnings and economic news was pretty good yet the market shrugged it off. The first sign of a real turn may come when good news starts being ignored by the markets. Watch this carefully to see if it continues.


This is really a RANGE BOUND market until the election and FOMC meeting next week and I expect little to change until then. Today’s close was the 18th close within the 17 point range and the seventh within a seven point range. We may find ourselves staying right in this zone until after the election and the FOMC meeting on Wednesday.


For the SPX Index there was 250 Advancers/237 Decliners. On the NYSE 3,117 issues were traded with 1,531 advancing issues and 1,462 retreating issues, a ratio of 1.05 to one advancing. There were 149 new highs and 14 new lows. The five day moving average of New Highs is 172 while the five day moving average of New Lows is 10 and the ten day moving average of Net Advancing is 8.
 
Declining volume was higher at a ratio of 1.06 to one. The NYSE Composite Index gained 0.32% today while the SPX gained 0.11%.
 

Breadth was slightly positive today while advancing volume was negative. This is uncommon but we have seen it several times recently. We’re watching the ten day average of Net Advancing closely. This number is hovering near zero but any real pullback will see it fall below -200 and any sustainable bounce will see it move beyond 200.
 
Total tick for the day was 35,000 and the average tick for the day was 23. There were 108 ticks greater than 600 and 95 ticks more extreme than -600. There was 1 tick greater than 1000 and 5 ticks more extreme than -1000.
 
The intraday volume pattern shows an uptick in volume on the late morning down move, but volume continues to be light. Any real move, either direction, should come with amplified volume.

The nightly breadth indicators are being a bit more consistent the last few days as we are starting to see some signals of impending weakness. The McClellan Oscillator is starting to stay in negative territory and the McClellan Summation Index is falling. The Absolute Breadth Index is nearing the 52 week low which is strongly suggesting a topping process.


So looking ahead to Friday, I expect the volume will be sluggish. I expect good news in the GDP to play out poorly in the market. It will be cheered initially and then faded. As you have seen all week, the market is divided.

Thursday, October 28, 2010

Bonds Away!

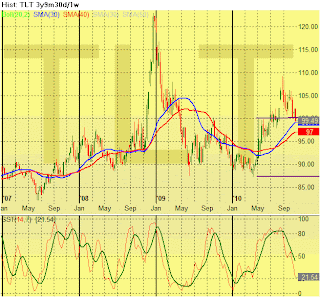
Good afternoon, as you may have read I have been bearish on the US long bond for a while. I was early buying the TBT (inverse 2x TLT) on this trade and took about a 8% loss initially. Then I was lucky enough to add around $30. This trade looks like its turning at this point the TLT has recently broken major support at a hundred and is set to move lower as the bond bubble unwinds and it will. The major reason for this is there is a change in the thinking of all our  creditors, they are unhappy with our borrow and spend policy.


There has also been a lot of blame thrown on the Chinese for currency manipulation. In the nineties when the Yuan was pegged, no one said a word about it, why because back then the dollar was strong, no one cared. So know when the dollar is falling almost on a daily basis the Chinese are to blame. Even tough I believe the yuan needs to rise but only because of the fundamentals of the Chinese economy not because the US feels 10-20 percent rise in the Yuan will restore the trade surplus. This was also seen in Japan as the Yen rose 300-400 percent against the dollar and it did noting to fix the trade imbalance with the us (1970-Present)

The world is moving away from the dollar, the US may find it more difficult for people to lend us money, this isn't a one year move I think this will be a problem for 10-20 years. Think about how big the domestic economy is how the government is so set in its ways, they keep telling you they are going to keep the pedal to the metal in terms of supply. We keep spending on war, military, larger government. Print and spend baby!


So how does this relate to the bond market, take a look at the chart above I think its going to get a little support hear at the 30 and 40 wk sma and finally break down to the 89-90 level. I will re-evaluate as this plays out.

So the way to play this via the TBT:


This is a weekly chart of the TBT, i dont think you are going to see $31 any time soon but i will be adding at 32.25 or so. Doug Kass of RealMoney.com Silver feels it could be "the trade of a decade".

more to follow

Wednesday Recap

Before the market open the dollar was rising and the futures were lower as well. The Commerce Department reported that Durable Goods orders increased by +3.3% in September, which was above the consensus expectations for +1.8%. The August reading was revised higher to -1.0% from -1.5%. When you strip out the volatile orders for transportation, orders fell by -0.8%, which was below the consensus for +0.5%. The August reading was revised higher to+1.9% from +1.7.

The session began with about a four point gap down. Bears pushed the it down several more points before the bulls mounted a snapback right at 10:00 am. But the bears teased traders again by regaining control and pushing down to put the first leg of a double bottom on the chart just after 11:00 am. After a brief bounce the low of the day was put on the chart at 1:16 pm. Market was still in negative territory for the SPX and Dow, but significantly off the lows, ten points higher.

Looking at our Market Leader’s board, we see mixed results as the chip makers (SOX) was up strongly and the Financials (XLF) managed to close barely into positive ground. The XLF remains the serious laggard on the board.


The SPX index continues trapped within the tight closing range of the last 17 sessions. During this time frame we have closed between 1158 and 1185, only a 17 point spread from top to bottom, and the last six sessions have been even tighter, closing within a seven point range.

Of interest regarding tight range and declining volume, two similar periods this year: Mid January and mid April. if you look up a chart, show similarities and look what happened after each time period and draw your own conclusions about what may happen in the weeks to come. Momentum indicator have also peaked.


Declining volume was higher at a ratio of 1.73 to one. The closing TRIN was 0.91 and the final tick was -625. The NYSE Composite Index lost -0.66% today while the SPX lost -0.27%.

For the NYSE, relative to the previous 30 session average, volume was -3.49% below the average. Of the last 15 sessions 6 sessions ended with volume greater than the previous rolling 30 day average volume. Of the last 30 sessions, 21 sessions ended on a positive tick, 7 of last 10. For the SPX, the day's volume was 93.6% of the average daily volume for the last year. Volume was 88.4% of the last 10 day average and 101.6% of the previous day’s volume.

Breadth was negative today yet the negative volume was not as negative as might be expected. But New Highs were the lowest since July 16th and New Lows were the highest since September 28th. Volume remains light and the final tick was the most negative since September 27th. Be sure to notice that the broad NYSE Composite Index underperformed the SPX significantly today; this is often a bearish sign.

The tick data certainly suggests a lack of panic selling today as evidenced by the mild action within the greater than 600 tick range.  Still, we have seen this for the last week and a half and yet the SPX continues to be range bound.

Looking at the nightly breadth indicators, we see the McClellan Oscillator finally moving into negative territory. The McClellan Summation Index has begun to decline as well. But what catches our attention is the Absolute Breadth Index; this is the lowest it has been since early April. 55.00% of the SPX components are giving a crossover Buy signal; 18.20% of the SPX components are giving a Sell signal. This is a 3 to 1 ratio of Buy signals over Sell signals.
40.8% of the SPX are above their five day moving average, 47.8% are above their 10 day average, 62.4% are above their 20 day moving average, 83.6% are above their 50 day moving average, 80.6% are above their 100 day moving average, 72% are above their 150 day moving average, and 72% are above their 200 day moving average. 

Another interesting thing I am seeing is that the emerging markets are weakening, probably due to recent strength in the dollar, because most of those indices are resource stock heavy. But they lead the way down in April and this maybe the canary in the coal mine. 


I think we retest the 200wk moving average, fail and head back down in the middle of next week, long term outlook unchanged see previous posts. 

Wednesday, October 27, 2010

Tuesday's Market Recap

Markets were down in Asia, Europe was in the red and the US futures pointed to a grim day or if you are short like I am a, well a rare good day. Then we got a slightly better than expected consumer confidence number and we had a snap back rally. We printed an almost exact opposite of the gravestone doji on the SPX, its a reflection of the battle thats being fought on the ground between the bulls and the bears and the bulls have been winning, taking small bits of ground and pushing their enemy back. During the two sessions, we have covered the ground from 1177 through 1196 but today’s close is less than a point higher than Monday’s open. A lot of noise but the market has accomplished little. 


We have also seen reversals; these occur much more frequently at market tops. In the last ten sessions we have had six reversals. Ten sessions ago we closed at 1178; only seven points lower than where we currently are.


The more interesting action today was in the dollar and bond markets. The yields in the short term maturities sky rocketed and in the longer term yields were up significantly (Long TBT). The dollar got bid up as the yen weakened on news of QE by the BOJ, was stronger against the euro as well. One would think that the commodity sectors would be down on the  back of this but most sectors were up. Nat Gas, oil, gold , silver and the Ag's. I think its the rotation to previous strength. Tech has also been incredibly strong and yesterday it printed a "Golden Cross", 5dma crossing above the 20dma". (usually a very bullish sign).


For the NYSE, relative to the previous 30 session average, volume was -8.44% below the average. Of the last 15 sessions 6 sessions ended with volume greater than the previous rolling 30 day average volume. T


The breadth numbers were not bullish. We had negative advancing issues and negative volume. New Highs were down sharply and it’s only the second time in a month that New Lows reached double digits. The broad NYSE Composite Index underperformed the SPX. And, the ten day average of Net Advancing has dropped below 200 for only the third time since this two month rally began.


I am holding on to my short-term bearish stance. The technical indicators I follow are all lining up for a pullback (futures are down a little this am as I write this). I believe we are headed to test 1160 and then the 150dma if the SPX takes out 1196 which is the 200wkma or the mother of all averages all bets are off.


There are reason why I don't think we go higher. The volume just isn't there on up days and is much higher on down days. The fund managers are only in 3% cash, where will the get the powder to blow this up higher. There are two many bulls, 49% to only 25% bears almost 2:1 bull/bear ratio as per AAII data. The expectation of the size and efficacy of QE2 are to high that if the FED should disappoint this will get really ugly for the bulls and quickly (i'm betting it will). Expectations are the seeds of resentment! (long FAZ, ZSL, DZZ, BGZ)


My longer term outlook hasn't changed. Short dollar, long precious metals (GLD, SLV), short bond with long TBT, long uranium basket  (USU, UEC, CCJ, URZ ), nat gas( UNG), long oil (USO, XLE), and Ag (DBA, MOO), and long EEM. 


Monday, October 25, 2010

Monday Recap

The futures were up significantly in the premarket on the back of the G20 meeting and the decline in the dollar. Existing home sales came in at 453,000 at 10am. 23,000 more than expected, most of those were distressed sales. 

SPX gapped upward of about seven points then continued upward another seven points to put the high of the day on the chart at 10:00 am. The rest of the day was choppy, mostly in a tight range until the last half hour when sellers arrived and took the index down sharply initially. And we printed an inverted hammer, a sign of exhaustion and rejection or reversal of an uptrend. Interesting to see the VIX up nearly 6% at one point on an up day. 

Commodities were strong across the board today except natural gas which was down 2% early and turned positive near the end of the session. Financials were weak again today. The breadth was positive today, the advancing volume was greater than declining volume, but the volume was light on the gap up or breakout and increased heavy during the late selling period.


One stat of interest is that the NYSE Advance/Decline line hit a new high today while New Highs were hitting 305. This is a rather anemic New High total compared to April when we were seeing the A/D line hitting all-time highs and the New Highs were in the 600’s.


So no of this will mean anything unless there is follow through of the selling we saw. And we havent had that in about six weeks. As I have been saying we are overbought according to indicators, but we can stay over bought for extended periods, topping takes longer than bottoming and is harder to call. I'm still shorting this market and 25% in cash. Will add to shorts at 1196. 


Long-term bullish commodities, bearish dollar, bullish emerging markets Brazil, India, China, Chile, Peru, Turkey, and South Korea (BIC) (TPCK)


Debt Crisis in our future: posted 10/25/2010

In the past 10 years we have had two great bubbles the tech bubble and then the subcrime bubble. The next bubble is going to be the US Government debt bubble. This will lead to a transition from money flows from US as foreign creditors leave dump our bonds and find other places to put their money, mainly China and India. The way out of this bubble is something the US Govt is unlikely to do and that is to take austerity measures (just can't go through the pain) for 3-5 years so they will keep printing more money thus driving down the dollar & driving up commodity prices, across the board.

The us equity markets will under perform the emerging markets and that we have already seen, over past decade and will see in the next ten years. For example, the Bombay stock exchange is up 270% in the last ten years and the S&P has gone nowhere in that time. Gold, Silver, Platinum, Uranium, Oil, Gas, and Agricultural commodities have risen will soar in price (and relative to the S&P they already have outperformed) especially when the $h^t hits the fan.

With unemployment rates remaining high the consumer will continue to be under pressure leading to decreased consumption, greater risk of credit defaults and foreclosures. And this will play out over years, possibly the next ten years or so. This is the SECULAR TREND.

At this time there is an irrational exuberance and the market has taken it as a given that QE2 will be large in amount and efficacious in result. A pullback is on its way, when exactly I'm not certain. All the technical indicators are lining up for a top in the market, see previous post. Upside potential for the S&P is 1220 from here (short-term), if there is a breakout we could get another 100-150 points. On the downside, risk is to fall to 1120. If that doesn't hold I think we can go down to 1060.

The way to protect yourself (inflation/debt crisis) or make money is pretty simple, go long commodities eg. energy, metals, Ag ETF's: XLE,  SLV/GLD 2:1 respectively, UNG, MOO, DBA and a basket of uranium related stocks (CCJ,URZ, UEC). Shorting long bond (TBT)

Sunday, October 24, 2010

Friday's Trading Session 10/22/10

Hello was anyone at a trading desk???


In a nut shell it was over in the first hour. There were no buyers or sellers. Friday marked the second session in the last six that the entire day’s trading range was defined within the opening hour; this is usually a two or three time per year occurrence. This is a characteristic of a topping process; this rarely happens except at market tops.


The sellers have been hammered since late August. This market has ignored all the technicals and just gone higher. Hedge funds are chasing performance as they are behind by 500 basis points. Mutual Funds are all in at 3% cash level according to Prechter in CNBC interview (Sept 29th) with Maria B. So where is the money going to come from to push this even higher (Leverage/Margin). I don't know but I have been hearing this for a while now and it just keeps going higher. Every time I have shorted my stops have been triggered within a day or so. 


"Tis' the season to be Bullish"


There are a lot of things pointing to a top but the market participants have simply ignored them. This will end badly but when?? I have no idea. I have been wrong so much I have lost all confidence in the indicators I have followed and myself. 


Signs of a top: Resistance levels, This market is up against strong long-term resistance levels, Dow off 100 points and S&P 40 points from the April high. The breadth in the market is deteriorating somewhat and the volume on up days vs. down days is not very strong


The four week RSI of the four indices (SPX, Dow, NASDAQ, and Russell 200) has reached 88. This is the highest RSI since the April highs when the RSI reached as high as 95, but pullbacks often occur as this RSI reaches 80. 73.6% of stocks in the S&P are above their 20 day moving average, signifying extreme bullishness. AAII Investor Sentiment is showing 49% bull vs. only 25% bears (this is usually a bearish indicator for markets). Weekly Stochastics are also showing overbought conditions, though not as high as April as yet.


I am staying short for now with a quick cover trigger finger, long-term I understand the S&P is cheap in terms of forward earnings and corporations are putting up fabulous results beating estimates, emerging markets are doing well those markets are up big but from I have read their leading economic indicators are declining especially in China and India. They are all benefiting from a weak dollar. You saw what happened last week when the dollar rose, EEM dropped  3.5% in a day. The Dollar is bottoming at least in the short-term, I think this keeps a cap on where the markets, metals go for the next two months or so. Long-term I think we do see a weaker dollar because the fed has to keep borrowing (Peter to pay Paul) at some point we need to be fiscally responsible before we turn into Greece.