Friday, January 21, 2011

Bonds and Dollar Update


1/20/11

Bonds were absolutely crushed today falling nearly two full points again in yet again a repeat of the pattern that we have now been spectator to for the last month. They are unloaded whenever it appears that the global economy is entering a period of rising interest rates only to be artificially manipulated higher by the Fed’s QE purchases which then cause an almost immediate rebound from off the lows as bond traders anticipate the next entry by the Fed into the bond market. As said many times over the last month, the market is a joke with everyone on the planet being able to see the game being played by the Fed. Specs came in and sell them lower only to then have a certain crowd jump in and bid them right back up in front of the Fed with more specs then waiting to unload their freshly purchased bonds into the hands of the Fed and then repeat. Lather, rinse, repeat. I am going to watch and see if the bonds immediately move higher on the reopen of trading early this evening. That has been the pattern and will reveal that the crowd is once again expecting them to come in and put another floor under the market.
It will continue to work until it doesn’t.  Heaven help us all if 118^20 gives way on big volume. Then again, with a total commitment of $600 billion in freshly created “money” to be thrown at the market, it is difficult to imagine that. For now we play the game with the rest of the crowd and do the bidding of our monetary masters. This is what particularly galls me whenever I read comments from public US officials who have the temerity to lecture the Chinese on the level of the yuan.
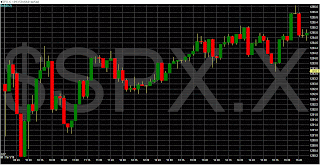
The Dollar was resuscitated right on schedule today as it is attempting to recapture important chart support near the 79 level on its daily price chart. Technicals are pointing lower however. What is amazing is that one can lay a chart of gold over the chart of the Dollar and the two markets have had nearly identical chart patterns since November of last year. I am not sure what to make of this just yet. One would expect a breach of support in the Dollar to garner buying interest in gold but that has not been the case for the last two months.
By Dan Norcini

Weakness on Gold and Silver


Weakness in gold and silver were blamed on several factors as trade moved into New York this morning.
Overnight Brazil hiked its core interest rate by 50 basis points and there was additional chatter of further interest rate hikes in China to combat surging inflation pressures on the heels of some data out of that quarter suggesting previous hikes in both interest rates and reserve ratio requirements are not having much effect on taming price rises. That led to a general reduction of the “risk trades” and selling in commodities as a whole. Witness the case of the two markets I like to track in the sector, copper and crude, which were both sharply lower, crude oil failing to hold support at $90 and copper getting spanked for more than 10 cents. Even corn, which has a strongly bullish set of fundamentals did not escape the selling barrage when it opened for trading in the pit this morning although it did finally absorb the algorithm selling before moving higher again. At least fundamentals are still ruling in a few of our markets. Ditto for wheat which is now trading above the $8.00 level as I prepare these comments. Food prices continue to rise – period.
There was also an unemployment number which came in lower than some were expecting leading some to talk up the prospects of the US economy which brought some strength into the US Dollar. The Dollar also was the recipient of a sharp selloff in the Yen and the commodity based currencies which moved lower as the risk trades were dumped. (Bonds were also sold down).

Brace for a ‘perfect storm’ in gold -FT.com


Brace for a ‘perfect storm’ in gold By Thomas Kaplan 
Published: January 18 2011 15:32 | Last updated: January 18 2011 15:32
Investment implies moving some part of one’s assets from financial safety to a position of acceptable risk with the hope of increasing wealth over time. What qualifies as “acceptable risk” may thus be seen to be the gating question for the investment criteria of a “prudent man”. This has come to be known as the Prudent Man Rule to guide persons entrusted with the finances of others.


World needs $100 trillion more credit


World needs $100 trillion more credit, says World Economic Forum 
The world’s expected economic growth will have to be supported by an extra $100 trillion (£63 trillion) in credit over the next decade, according to the World Economic Forum. 
By Emma Rowley 8:49PM GMT 18 Jan 2011
This doubling of existing credit levels could be achieved without increasing the risk of a major crisis, said the report from the WEF ahead of its high-profile annual meeting in Davos.

Anthony Bolton: 'Gold is the only commodity to buy'-Telegraph

Anthony Bolton: 'Gold is the only commodity to buy'

It's too late to join commodities party, the Fidelity fund star says.


http://www.telegraph.co.uk/finance/personalfinance/investing/8260049/Anthony-Bolton-Gold-is-the-only-commodity-to-buy.html

Secular Trends Portfolio Update

TOTAL GAIN/LOSS
YTD -2.89%

SPX +1.84%


GLD -5%
SLV -11.5%
 So lets look at some cases one could make for whats happening in the metals, case 1, We have gotten real excitement (Target 250) over the metals, mania (public) and a blow-off top (Nope not that right no evidence of it) Case 2. TRAP (Target 127 on GLD)? Volume of this sell-off has been peculiar to say the least the price keeps declining along with the volume and this could be the trap . If there was tremendous volume at the start people would have run for the hills, so one more big leg down to the 150 very possible). Case 3. Profit taking balancing (Target 130), re-balancing portfolio, (maybe but too easy not painful enough, and I haven't felt enough pain yet, usually when i sell its right at the bottom) Case 4. There is no inflation, debt situation improving, dollar is doing well, job growth! So we know its not the last scenario (Target 80). 

I think its case 2. though I really don't want to feel that pain but thats what you usually get if you want to ride the bull to the finish you gotta get prepared to get thrown off a few times!

Silver is a complete disaster! Down 11% plus on the year its really hurting to hold this right here. So here the situation, 25 was the level the shorts screamed as it blasted to 28, just look at the short covering volume and sell-off. I think we are at or near the completion of a head and shoulders pattern, today we need a big day of early high volume selling followed by late recover, need that hammer to print today.

Gold Miners 
GDX   -11%
GDXJ -13%


This is a thing of beauty, my target for the year is 7.5 bucks not too late to jump on board.

Uranium Miners Basket
URZ +19%
UEC -13%
CCJ-5%

Petroleum Energy
XLE+2.74%

Ag
DBA +2.25%

Short Long Bond
TBT +6.8%

Thursday Recap: A Look inside the markets


World markets followed Wall Street lower overnight. Trading overseas was also affected by the strong GDP report in China, which leads most to believe the tightening cycle is not yet over. This idea is also supported by reports that Chinese banks lent more than 1 trillion Yuan in the first 19 days of January, which far exceeded the allocation for the month (total allocation for the year is expected to be no more than 7.5 trillion Yuan). However, a good number from Weekly Claims has improved the mood a bit here in the U.S. The Labor Department reported that initial claims for unemployment insurance for the week ending January 15 fell by 37,000 to 404K. The week’s total was below the consensus for a reading of 423K. Continuing Claims for unemployment for the week ending January 1 were below consensus at 3.861M vs. expectations for 3.943M and last week’s revised (higher) 3.887M. Futures were modestly negative as the open approached.

The session began with a small one point gap lower but quickly traded five points down just minutes into the day. After a brief bounce through 10am sellers took over the tape and took the index to the low of the day at 11:34. Then the familiar pattern of buying the dip began. There was a slight pullback just after 1pm but most of the session after the morning lows was consistently higher until the high of the day at 2:44. While trade was choppy the last hour, it was consistently lower as the index gave back a third of the day's range in the last 75 minutes.


For the SPX Index there were 226 components advancing and 254 components declining. On the NYSE 3,132 issues were traded with 1,141 advancing issues and 1,892 retreating issues, a ratio of 1.66 to one declining. There were 44 new highs and 24 new lows. The five day moving average of New Highs is 204 while the five day moving average of New Lows is 71 and the ten day moving average of Net Advancing is -102.
 
Declining volume was higher at a ratio of 1.16 to one. The closing TRIN was 0.7 and the final tick was -510. The five day average of TRIN is 1.31 and the ten day average of TRIN is 1.16. The NYSE Composite Index lost -0.35% today while the SPX lost -0.13%.
 
For the NYSE, relative to the previous 30 session average, volume was 25.46% above the average. Of the last 15 sessions 10 sessions ended with volume greater than the previous rolling 30 day average volume. Of the last 30 sessions, 18 sessions ended on a positive tick, 7 of last 10. For the SPX, the day's volume was 108.1% of the average daily volume for the last year. Volume was 107.8% of the last 10 day average and 107.2% of the previous day’s volume.
 
Breadth was more negative than might be expected for a day when the SPX was down less than two points. New Highs were quite low; the lowest since November 23rd. The ten day average of Net Advancing has dropped below zero also for the first time since the end of November.
 
Total tick for the day was 97,000 and the average tick for the day was 63. There were 101 ticks greater than 600 and 37 ticks more extreme than -600. There were no ticks greater than 1000 and no ticks more extreme than -1000.
 
The intraday volume pattern today is unmistakable as volume clearly sagged on the downward moves and spiked on the upward moves. Checking the Nightly Breadth Indicators reveals a somewhat mixed bag suggesting choppy trade at least for tomorrow. But it is interesting to see the McClellan Oscillator move beyond oversold already. The Absolute Breadth Index and the High Low Logic Index are both suggesting that the market has hit a significant top.

Sectors Performance
 
Sectors stronger than the SPX for Thursday:
- Financials -- Outperformed the SPX by +80%.
- Consumer Staples -- Outperformed the SPX by +63%.
- Utilities -- Outperformed the SPX by +88%.
- Health Care -- Outperformed the SPX by +37%.
- Consumer Discretionary -- Outperformed the SPX by +33%.
 
Sectors weaker than the SPX for Thursday:
- Basic Materials -- Underperformed the SPX by -104%.
- Energy -- Underperformed the SPX by -62%.
- Industrials -- Underperformed the SPX by -38%.
- Technology -- Underperformed the SPX by -42%.


Thursday, January 20, 2011

Analysis: US-China tensions may grow again


WASHINGTON (AP) — Despite the pomp, pageantry and vows of cooperation, tensions between the United States and China are likely to grow — not shrink — after President Barack Obama's summit meeting with Chinese President Hu Jintao.
While the United States struggles with near-chronic unemployment and a continuing housing crisis, China was the first major economy to power out of the global downturn and recently passed Japan as the world's second-largest economy.


http://www.foxnews.com/us/2011/01/19/analysis-china-tensions-grow/

Gold 2000?

JOHN EMBRY:  I couldn't be more bullish actually, despite the rather slow start we've had to the year - this is typical.  This is now the third year in a row that gold has been leaned on at the beginning of the year and gold shares have done very poorly at the outset only to recover smartly as the year has gone on.  I see exactly the same thing unfolding this year - the fundamentals are impeccable.  The price has clearly been suppressed here in the paper markets.  The physical demand is on fire - both gold and silver in physical demand is terrific, particularly in the East where you see huge premiums opening up on the quoted prices and sentiment strangely enough, in the face of all this is really quite negative.  A lot of people have been discouraged by the short term price action.  I believe it's another fabulous buying opportunity.


http://goldsilver.com/news/gold-should-hit-2000-this-year-john-embry/

Wednesday Recap: A Look Inside the market

Wednesday morning traders appeared to be digesting conflicting earnings reports from the likes of IBM, Apple, and Goldman Sachs. Housing Starts fell by 4.3% in December to an annualized rate of 529K. This was below the consensus for 552K. In addition, the November numbers were revised lower to an annualized rate of 553K from 555K. Building Permits for December rose to 560K. This was above the consensus of 553K and last month’s reading of 544K. The bottom line is there continues to be an overhang of inventory in the U.S. housing market. Futures were weak as the open approached.

The session began with an insignificant gap lower but sellers were plentiful early and the index began a downward trek. It was an orderly descent with no real signs of any panic as volume was moderately low. But the tick action revealed a total lack of buyers; something quite rare over the last twenty-two months. Today finally provided some relief for the bears. The high of the day was the open and the low of the day was 3:33pm. So we saw a bearish reversal of the time of day for the high and low but the question remains whether the bears can continue to push this lower or whether the dip buyers will be out in force Thursday.


Sectors Performance: 
 
Sectors stronger than the SPX for Wednesday:
- Technology -- Outperformed the SPX by +25%.
- Consumer Staples -- Outperformed the SPX by +84%.
- Utilities -- Outperformed the SPX by +105%.
- Health Care -- Outperformed the SPX by +37%.
- Consumer Discretionary -- Outperformed the SPX by +22%.
 
Sectors weaker than the SPX for Wednesday:
- Basic Materials -- Underperformed the SPX by -123%.
- Energy -- Underperformed the SPX by -19%.
- Financials -- Underperformed the SPX by -125%.
- Industrials -- Underperformed the SPX by -4%.


For the SPX Index there were 62 components advancing and 422 components declining. On the NYSE 3,139 issues were traded with 697 advancing issues and 2,358 retreating issues, a ratio of 3.38 to one declining. There were 187 new highs and 22 new lows. The five day moving average of New Highs is 217 while the five day moving average of New Lows is 74 and the ten day moving average of Net Advancing is 32.
 
Declining volume was higher at a ratio of 8.33 to one. The closing TRIN was 2.46 and the final tick was -199. The five day average of TRIN is 1.27 and the ten day average of TRIN is 1.16. The NYSE Composite Index lost -1.05% today while the SPX lost -1.02%.
 
For the NYSE, relative to the previous 30 session average, volume was 12.62% above the average. Of the last 15 sessions 9 sessions ended with volume greater than the previous rolling 30 day average volume. Of the last 30 sessions, 19 sessions ended on a positive tick, 8 of last 10. For the SPX, the day's volume was 103.7% of the average daily volume for the last year. Volume was 100.8% of the last 10 day average and 83.9% of the previous day’s volume.
 
Breadth was very negative the entire session. But it is interesting to note that the New Lows did not explode higher as might have been expected.
 
Total tick for the day was -285,000 and the average tick for the day was -184. There were 0 ticks greater than 600 and 174 ticks more extreme than -600. There were no ticks greater than 1000 and 12 ticks more extreme than -1000. The tick action suggests institutional distribution.
 
Volume was not heavy today but clearly the intraday volume pattern shows surges of volume with each wave lower. Looking at the Nightly Breadth Indicators also clearly shows some bearish looking indicators. The ten day average of the McClellan Oscillator has already moved into negative territory and all of the New High/New Low ratios have flipped bearishly. 


Wednesday, January 19, 2011

Dollar Falls to 8 Week Low-Marketwatch.com

NEW YORK (MarketWatch) — The U.S. dollar lost ground Wednesday, helping the euro touch its highest level in two months, as investors became more comfortable with Europe’s debt situation and looked forward to economic data from China.


http://www.marketwatch.com/story/dollar-edges-lower-vs-major-rivals-2011-01-19?siteid=rss&rss=1

Tuesday Recap: A look inside the market


A better-than-expected bond auction in Spain, word that Russia will resume buying EU debt, and talk of an expanded Eurozone rescue fund improved the mood a fair amount. But then, Citi's weak earnings report pushed the SPX and Dow futures back into the red as the open approached. The Empire Manufacturing Index for January was reported at 11.92, which was below the consensus expectations for a reading of 12.8. The index was above the December reading of 10.57. Looking beyond the headlines, the New Orders component came in at 12.39 (vs. December 2.03) and the Employment component was reported at 8.42 vs. -3.41.


Intraday 5 min


After the extended holiday weekend, the shortened option expiration week began without a gap. The index made a couple of slow three point up-and-down moves before 11am before settling on a gentle drift higher. But on this day of tight range trading, higher wasn't much. But once again we see buyers pounce on even the slightest of dips as this market continues to show not even the slightest of mercy to bears. The high of the day was at 3::43pm after a low of the day early in the session at 9:54am. Late day highs and early morning lows; we continue to see a bullish pattern.


Sector Performance: 
 
Sectors stronger than the SPX for Tuesday:
- Basic Materials -- Outperformed the SPX by +41%.
- Energy -- Outperformed the SPX by +48%.
- Industrials -- Outperformed the SPX by +58%.
- Utilities -- Outperformed the SPX by +9%.
- Health Care -- Outperformed the SPX by +23%.
- Consumer Discretionary -- Outperformed the SPX by +15%.
 
Sectors weaker than the SPX for Tuesday:
- Financials -- Underperformed the SPX by -77%.
- Technology -- Underperformed the SPX by -6%.
- Consumer Staples -- Underperformed the SPX by -8%.


For the SPX Index there were 298 components advancing and 180 components declining. On the NYSE 3,140 issues were traded with 1,646 advancing issues and 1,393 retreating issues, a ratio of 1.18 to one advancing. There were 305 new highs and 47 new lows. The five day moving average of New Highs is 218 while the five day moving average of New Lows is 72 and the ten day moving average of Net Advancing is 115.
 
Declining volume was higher at a ratio of 1.31 to one. The closing TRIN was 1.55 and the final tick was -100. The five day average of TRIN is .94 and the ten day average of TRIN is 1.0. The NYSE Composite Index gained 0.2% today while the SPX gained 0.14%.
 
For the NYSE, relative to the previous 30 session average, volume was 28.25% above the average. Of the last 15 sessions 8 sessions ended with volume greater than the previous rolling 30 day average volume. Of the last 30 sessions, 20 sessions ended on a positive tick, 9 of last 10. For the SPX, the day's volume was 115.5% of the average daily volume for the last year. Volume was 123.6% of the last 10 day average and 114% of the previous day’s volume.
 
Declining volume was higher than advancing volume; the action today was in the declining stocks. New Lows remain quite high considering that the indices are making new 52 week highs. The extreme ticks continue to show institutional selling but the indices continue to creep upward.

Total tick for the day was 48,000 and the average tick for the day was 31. There were 9 ticks greater than 600 and 33 ticks more extreme than -600. There were no ticks greater than 1000 and no ticks more extreme than -1000. The tick action suggests institutional distribution.
 
With such a lack of range and lack of volatility it is impossible to make much of any volume pattern. Looking at our Nightly Breadth Indicators also doesn't reveal much as the indicators really didn't move much from Friday. But it is curious to note that many of the indicators were down on an up day today. Of particular interest is the Cumulative Volume Index moving down today. But we all know that right now nothing matters as every two point dip creates a buying frenzy.

Commodity Boom Signals Growth- Bloomberg


U.S. investors should welcome, not fear, climbing commodity prices.
The increases are “largely a reflection of the fact that the pace of economic growth, particularly in the U.S., has picked up,” saidNariman Behravesh, chief economist at consultants IHS in Lexington, Massachusetts, and a former Federal Reserve official who has been covering the global economy for more than 35 years. “It’s not something to be worried about.”


http://www.bloomberg.com/news/2011-01-19/commodity-boom-signals-u-s-accelerating-with-corporate-america-benefiting.html

 “It’s not something to be worried about.” REALLY?!?


Tell that to the people on food stamps and the unemployed or those who are retired and fear losing their pensions, and what will happen when the dollar is no longer pegged to commodities. There is no job growth they are just counting less people as unemployed. When your unemployment benefits run out they no longer count you as unemployed.


Tuesday, January 18, 2011

In the News Today

1. Inflation Jumps in UK- NYTimes
http://www.nytimes.com/2011/01/19/business/global/19pound.html?_r=1&partner=rss&emc=rss

2. EUR Jumps on German Confidence Numbers-Reuters

http://www.reuters.com/article/idUSTRE70D1FB20110118?feedType=RSS&feedName=businessNews&utm_source=feedburner&utm_medium=feed&utm_campaign=Feed%3A+reuters%2FbusinessNews+%28News+%2F+US+%2F+Business+News%29

3. Debt Ultimately moves the gold market right now were seeing short term profit-taking 


U.S. debt tops $14 trillion, nears ceiling Washington Post Monday, January 17, 2011


http://www.washingtonpost.com/wp-dyn/content/article/2011/01/16/AR2011011604005.html


4. Central Bank steps up its cash support to Irish banks financed by institution printing own money
Emergency loan programme of €51bn isBy Donal O’Donovan
Saturday January 15 2011
EMERGENCY lending from the ECB to banks in Ireland fell in December, the first decline since January 2010, but only because the Irish Central Bank stepped up its help to banks.
5.States Warned of $2 Trillion Pensions Shortfall
Tuesday, 18 Jan 2011 | 4:51 AM ET
By: Nicole Bullock, Financial Times
US public pensions face a shortfall of $2,500 billion that will force state and local governments to sell assets and make deep cuts to services, according to the former chairman of New Jersey’s pension fund.
The severe US economic recession has cast a spotlight on years of fiscal mismanagement, including chronic underfunding of retirement promises.
http://www.cnbc.com/id/41129099

6.Camden, NJ braces for deep police, fire cuts
Camden, NJ, poor and crime-ridden, braces for deep cuts, slashing of police, fire staffsGeoff Mulvihill, Associated Press, On Sunday January 16, 2011, 4:21 pm EST
CAMDEN, N.J. (AP) — Yet another crisis is upon this burdened city, among the most impoverished and crime-ridden in the country.
Deep layoffs of city workers go into effect on Tuesday — cutting up to 383 jobs, or one-fourth of the city’s employees.
http://finance.yahoo.com/news/Camden-NJ-braces-for-deep-apf-1702037661.html?x=0&sec=topStories&pos=2&asset=&ccode=