Friday, November 12, 2010

Chart UUP

This week

Its had a nice move up from the Fed announcement, now its time to head back down


Arrow indicates gap thats filled this week. Circle the after math of the FED announcement, small Inverse HNS rally up to fill gap and make a HNS and move back down by next week. 


We maybe headed to 200wkMa (arrow), as HNS with capitulation on or around FED announcement and bounce to approximately 80 may be inorder


SLV HNS

Wed

Today
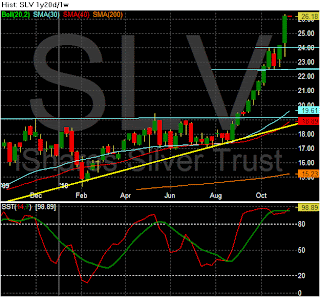
I think we had the sell off and I bought a little today at 26 and 25.5, if it gets below 25 I'm out the new positions!


Right where it broke out last week sold (75% of  BGZ for a quick double digit gain (see previous posts)
Will buy more if SPX break 1195 (25% to run)

SLV/GLD follow up


Even though I am experiencing a big draw down this week and this am I am liking the action in the SLV. I would love it to consolidate here at 26ish for a while before taking out the ceiling in the new channel its forming. I am going to put in a bid at 26 with a 5% stop loss under that for the new position. I'd like for that volume to calm down. 

Like to get some more at the support line don't think it'll get there, but put in orders maybe there is some panic in the weak hands and someone drops some shares over to me. Gotta be patient during draw downs.


Tuesday Recap: A look inside the market

The market pre-open was marred by Cisco Systems report and John Chamber's comments that caused the stock to fall -$4 or -17% from yesterday's close. This was putting pressure on the futures leading to some selling at the open. We had no economic data on Thursday due to Veteran's Day.

Today’s session began un with about a ten point gap down. The low of the day was quickly put on the chart just fifteen minutes into the session as once again the dip was used as a buy signal. The high of the day was at 2:37, more than ten points off the low. The rest of the session was choppy with somewhat of a bearish bias.

When you consider the pummeling that Cisco received after their earning report yesterday, today’s market actually held up pretty well. What could easily have been a twenty point decline turned into only five.

Looking at what was moving and holding up Chinese stocks and ETF's and The Russell were higher and the tech stocks were lower but not as badly beaten up as once would have been off of what CSCO said.


 China being higher isn’t a great surprise but finding the Russell Technology unaffected by the Cisco inspired sell-off today is a bit surprising and puzzling.


Looking at the daily SPX chart we see another lower high painted on the chart but today’s low bounced right at the 1205 area of yesterday’s low. This 1205 level is becoming more important with each bounce from there; any break below 1205 seems almost certain to quickly bring us to the 1196 area.


For the SPX Index there were 223 Advancers/259 Decliners. On the NYSE 3,100 issues were traded with 1,058 advancing issues and 1,941 retreating issues, a ratio of 1.83 to one declining. There were 126 new highs and 20 new lows. The five day moving average of New Highs is 272 while the five day moving average of New Lows is 14 and the ten day moving average of Net Advancing is 337. The Net Advancing data indicates a bullish trend.

Declining volume was higher at a ratio of 1.63 to one. The closing TRIN was 0.89 and the final tick was -286. The NYSE Composite Index lost -0.31% today while the SPX lost -0.43%.

For the NYSE, relative to the previous 30 session average, volume was -9.36% below the average. Of the last 15 sessions 6 sessions ended with volume greater than the previous rolling 30 day average volume. Of the last 30 sessions, 23 sessions ended on a positive tick, 7 of last 10. For the SPX, the day's volume was 85.5% of the average daily volume for the last year. Volume was 109.1% of the last 10 day average and 108.4% of the previous day’s volume.

The New Highs continue to take a hit while the New Lows are building. But as long as the ten day average of Net Advancing remains above 200, the uptrend continues. Notice that the ratio of declining volume was lower than the ration of declining issues; this can’t be construed as bearish. And the NYSE Composite Index outperformed the SPX today as well.

Total tick for the day was 55,000 and the average tick for the day was 36. There were 74 ticks greater than 600 and 49 ticks more extreme than -600. There were no ticks greater than 1000 and no ticks more extreme than -1000. The tick action suggests institutional accumulation.

The significant thing to observe with the intraday volume pattern is that the volume dried up after the sell-off at the open. We once again see the index creep higher on low volume. The nightly breadth indicators have a bearish appearance about them, as would be expected on a down day. We are keeping our eye on the McClellan Oscillator and the Summation Index. As long as the Oscillator remains negative we are vulnerable to a pullback. And until the Summation Index turns negative, any pullback is going to remain shallow.


I am keeping by BGZ position, and will add to it once the 5dma crosses below the 20dma, which I have been anticipating happening for a month now, and took hit albeit small ones as the market either did nothing or crept slightly higher. 


Metals are getting walloped this am. I would have given up all my gains for the two weeks if I had not hedged and or  taken profits.  I'm look to add to positions in silver gold and uranium this morning and put some stops in place, the new hot money needs flushing out and we can get back to focus on the why these things are gonna keep going up. 


Thursday, November 11, 2010

SLV follow up


Looking for the 25.8 to 28.5 range to continue would love to keep trading in and out of this. But if I am looking at it like this then so is everyone else and thats why it will never happen. Trade what you see, not what you want!
Take a look at this link below to see whats going on on the inside with the silver markets.

Wednesday Recap: A Look Inside the market

In the pre-market traders digested the rate increase in China, the sovereign debt concerns in Europe, and the improving jobless claims report. The Labor Department reported that initial claims for unemployment insurance for the week ending November 6 fell by 24,000 to 435K. The week’s total was 15K below the Reuters consensus for a reading of 450K. Continuing Claims for unemployment for the week ending October 30 were below consensus at 4.301M vs. expectations for 4.343M. The government also reported that Import Prices for the month of October rose by +0.9%, which was lower than the consensus for an increase of +1.3%. Export prices rose by +0.8%, above expectations for +0.5%, and above last month’s unrevised +0.6%.

The session began without a significant gap and quickly moved a couple of points higher before sharply selling off for 30 minutes to put the low of the day on the chart at 10:06 am. But then dip buyers arrived and after about an hour of choppy trade the index began a relentless intraday climb higher. After several very minor pullbacks the session closed at the highs of the day.

Despite the bulls owning the tape throughout most of the session, there were no clear winners today. Bulls managed to regain slightly more than half of yesterday’s losses; each side may claim victory but in reality it was pretty much a standoff.


Last night after market close Cisco Systems reported and their guidance was weak, it sold off 11%. It will be important to watch tomorrow to see if this can follow through. 


For the SPX Index there were 327 Advancers/156 Decliners. On the NYSE 3,126 issues were traded with 1,879 advancing issues and 1,159 retreating issues, a ratio of 1.62 to one advancing. There were 117 new highs and 16 new lows. The five day moving average of New Highs is 275 while the five day moving average of New Lows is 11 and the ten day moving average of Net Advancing is 432. The Net Advancing data indicates a bullish trend.

Advancing volume was higher at a ratio of 2.33 to one. The closing TRIN was 0.7 and the final tick was 643. The NYSE Composite Index gained 0.59% today while the SPX gained 0.44%.

For the NYSE, relative to the previous 30 session average, volume was 5.5% above the average. Of the last 15 sessions 7 sessions ended with volume greater than the previous rolling 30 day average volume. Of the last 30 sessions, 24 sessions ended on a positive tick, 8 of last 10. For the SPX, the day's volume was 99.2% of the average daily volume for the last year. Volume was 100.5% of the last 10 day average and 98.2% of the previous day’s volume.

Today’s breadth stats are pretty much what would be expected after a five point rally with the exception of the New Highs and New Lows. Only twice since the end of August has New Lows exceeded today’s number. And similarly, only three times since the end of August has the New Highs been lower than today. This seems significant but as always, follow-through is the key.

Total tick for the day was 164,000 and the average tick for the day was 107. There were 144 ticks greater than 600 and 64 ticks more extreme than -600. There were 4 ticks greater than 1000 and 5 ticks more extreme than -1000. The tick action suggests institutional accumulation.

Intraday volume tailed off mid afternoon as the index was climbing. Looking at the nightly breadth indicators we find a mixed bag but we find the fact that the McClellan Oscillator remained negative on a positive SPX day somewhat interesting.


No Change in positions Long, BGZ (short-term Hedge), Long SLV, CCJ, URZ, UEC, TBT, GDXJ

Wednesday, November 10, 2010

Uranium Miners Follow UP

For those of you who missed the explosive move in the miners, here come the Gods of the market to let you in. This rarely happens. Or at least in my time (while trading). Wow did I cut it close to taking profits. I have been in a groove of late and for me thats rare. Must be the stars or something but its scaring me.

So now I'm gonna back to two positions I took profit in the last couple of days URZ and UEC this morning at the open.

Adding this am with the stop to the new position at 3.20

Adding to UEC with a stop at 5.20 for the newly added shares. 

This is just a shake out of the late comers, the weaker hands, the hot money, Bye Bye guys.


SLV follow up

I love this charts it shows fear greed and more fear!

Looks at  first the margin calls came in on the shorts and they got crushed, spike to 28.9, then we see the blow-off top as margin requirements change, hit money runs for the hills. Bought some back at the close silver will go higher as the fundes haven't changed, there is still big demand for silver, still needs to play catchup with gold although the recent 30% spike reversed alot of that. Silver is going to 50 by sometime next year. I hope we see some consolidation and decreased volatility and a NYJ /NYG super bowl (LOL)

TLT and TBT Follow up

See my previous post on this as to long term view, which remains unchanged!
I put this chart up October 28th and look whats happened to it since
I wrote in Bonds Away, where I thought this was headed. I am taking a little profit this morning in TBT.

Reached my initial target, add on pullback! Taking 25% off table


Tuesday Recap: A look inside the market

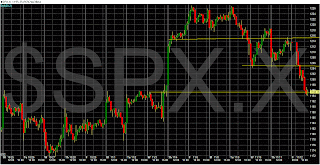
Yesterday I pointed out the weak support at 1214-1215 range, that broke. So now I am  looking for major support at 1193 and medium support at 1200 for the SPX. 


Stock futures were moving a little higher in the early going as a result of improving European markets, a lower dollar, and some M&A activity. The NFIB Small Business Optimism index for October rose +2.7 to 91.7 from 89.0 in September.

The Tuesday session began with a small gap higher before quickly retreating briefly into negative territory. But buyers then quickly bid the SPX up five points to put in the high of the day on the chart at 10:22 am.  Then the selling started, and buying was countered by selling and the sell volume was heavy, could this be a trend reversal. I have been talking about a top for the SPX for a long time now and have been wrong but this sure feels like one.


For the SPX Index there were 80 Advancers/407 Decliners. On the NYSE 3,133 issues were traded with 825 advancing issues and 2,214 retreating issues, a ratio of 2.68 to one declining. There were 300 new highs and 12 new lows. The five day moving average of New Highs is 271 while the five day moving average of New Lows is 9 and the ten day moving average of Net Advancing is 268. The Net Advancing data indicates a bullish trend.

Declining volume was higher at a ratio of 4.19 to one. The closing TRIN was 1.56 and the final tick was -416. The NYSE Composite Index lost -1.03% today while the SPX lost -0.81%.

For the NYSE, relative to the previous 30 session average, volume was 5.04% above the average. Of the last 15 sessions 7 sessions ended with volume greater than the previous rolling 30 day average volume. Of the last 30 sessions, 24 sessions ended on a positive tick, 7 of last 10. For the SPX, the day's volume was 105.5% of the average daily volume for the last year. Volume was 102.5% of the last 10 day average and 116.7% of the previous day’s volume.

Breadth was quite negative and declining volume was even more negative than breadth. But New Highs remains strong. The broad NYSE Composite Index underperformed the SPX and the final tick was negative for the first time since October 29th.

Total tick for the day was -192,000 and the average tick for the day was -125. There were 21 ticks greater than 600 and 172 ticks more extreme than -600. There were no ticks greater than 1000 and 21 ticks more extreme than -1000. The tick action suggests institutional distribution.

The tick data was very quiet early in the day buy by noon it was beginning to build on the bearish side. 21 -1000 ticks is uncommon but we have been seeing a lot of large negative ticks the last two weeks even on up days; someone large is distributing shares.

The intraday volume pattern continues to show heavy selling on down moves and light volume on up moves.

The breadth indicators are now bearish. 


Commodities especially silver were hammered yesterday (Charts up in a bit), the reversal was expected and I had lightened up and raised cash in anticipation. Greed may be good for Gordon but not for me!


Long BGZ (SPX 3x short), 25% cash, long TBT, SLV, GLD, Uranium Miners basket. 


Tuesday, November 09, 2010

CCJ update


Its going to 41 or so before major pullback.
Its time for it to make a little flag before next move higher.

Uranium Shares Spike After Cameco Report (CCJ, URRE, UEC, DNN, URZ, URA)

by Jason Smith | November 8th
Filed in: Commodity Stocks News | Stock Sector News

Canadian uranium miner Cameco (CCJ) jumped on Monday after posting its third-quarter results. The company earned C$80 million, or 20 Canadian cents per share, net of one-time items compared to C$172 million, or 24 Canadian cents per share, in the same period last year. Revenue slipped by -19% to C$419 million. Uranium sales volumes slipped by -33% year-over-year, but CEO Jerry Grandey noted that a decline was expected. “As we advised earlier this year, revenues were lower in the third quarter due to the timing of uranium deliveries. We expect about one third of our uranium sales will be delivered in the fourth quarter.” Grandey added, “We are on track to double our annual uranium production from existing assets by 2018.”
As a whole, the Uranium Stocks Index is soaring by 11% today, and Cameco’s 4% rally makes it a laggard for the session. The Index has now outperformed the S&P 500 by a whopping 45% over the last month.
Uranium Resources (URRE), Uranium Energy (UEC),Denison Mines (DNN), and Uranerz Energy (URZ) are all up by more than 10% today, and more than half of the Index’s components have now rallied by more than 50% since early October.
In the ETF space, the Global X Uranium (URA), which debuted last week, is up by 7% on the day, ranking it atop the Commodity ETFs Index for the session.

From TickerSpy


Monday Market Recap: A Look Ahead

Before I get started I just want to say WOW! Its like 1999 all over again but its not exactly the same (Tech is hot but not 3 alarm hot). This time its the metals and miners. Everyone is talking about Gold but Silver and Uranium stocks are just outright filthy smoking hot right now and there is now articulate way I know how to express that. If you have missed this move  I think you have to find a way to get in on pull backs or buy small amounts and keep tight stops on them so you don't get hammered. These stocks are very small in terms of market cap a couple I have went up over 30% yesterday. Look into ETFs as well there is a new one symbol URA and NLR which are basket of Uranium miners. So party on!


Stock futures were moving a little lower in the early going on the back of a rise in the greenback and lower European markets. There was no economic data scheduled for release today.

The week began with a four point gap lower. The index moved lower until 10:00 am before bouncing a few points. A sharp downward move began just before 11:00 to put the low of the session on the chart at 11:03 and then the bears once again vacated and allowed the dip buyers to move the tape higher most of the rest of the day as the session closed near the highs after another tight range session.


For the SPX Index there were 197 Advancers/290 Decliners. On the NYSE 3,129 issues were traded with 1,386 advancing issues and 1,633 retreating issues, a ratio of 1.18 to one declining. There were 287 new highs and 13 new lows. The five day moving average of New Highs is 254 while the five day moving average of New Lows is 9 and the ten day moving average of Net Advancing is 383. The Net Advancing data indicates a bullish trend.

Declining volume was higher at a ratio of 1.18 to one. The closing TRIN was 1 and the final tick was 520. The NYSE Composite Index lost -0.24% today while the SPX lost -0.21%.

For the NYSE, relative to the previous 30 session average, volume was -13.88% below the average. Of the last 15 sessions 7 sessions ended with volume greater than the previous rolling 30 day average volume. Of the last 30 sessions, 25 sessions ended on a positive tick, 8 of last 10. For the SPX, the day's volume was 85.7% of the average daily volume for the last year. Volume was 87% of the last 10 day average and 66.5% of the previous day’s volume.

Total tick for the day was 105,000 and the average tick for the day was 68. There were 73 ticks greater than 600 and 50 ticks more extreme than -600. There were 3 ticks greater than 1000 and 2 ticks more extreme than -1000. The tick action suggests institutional accumulation.

Intraday volume patterns still are showing increased volume on down moves. The nightly breadth indicators are mixed but continue to suggest that we are recovering from a pullback that we never saw.


63.40% of the SPX components are giving a crossover Buy signal; 11.60% of the SPX components are giving a Sell signal. This is a 5.5 to 1 ratio of Buy signals over Sell signals.

71% of the SPX are above their five day moving average, 81% are above their 10 day average, 78.8% are above their 20 day moving average, 85.8% are above their 50 day moving average, 89% are above their 100 day moving average, 81.8% are above their 150 day moving average, and 79% are above their 200 day moving average.

There were no significant moving average crossovers today but we still see Russell Technology and the SOX moving closer to their Golden Cross.


Monday, November 08, 2010

GLD Follow up

Buying more GLD once It his 135.5, stop in the new position at 135

Weekly stochastics turning up I doubt we get back to 130 before we get to 150. If we are lucky enough to get to 130 I will load up on double Gold or leveraged ETF (DGP)

Interesting read on Gold Below

SLV follow up

30min interval Intra-day chart of SLV shows a nice bull flag (arrow) I wanted this this to pull back to 24 but I don't think its going to happen due to the fundamentals right now. Big buying season in India due to wedding season other reasons as well see Kingnews link for more. Silver has lagged Gold run up and is now playing catch up!


Weekly chart shows the enormous move we have had in Silver, the shorts are just now getting squeezed. The Stochastics have turned up again, so I think we have seen a near term pull back (wasn't much). Silver goes much higher. 


Uranium Miners On Fire

Weekly
Intraday 30min Currently trading at 3.43

URZ up nicely again in the pre-market. I have a cost basis in this one at 2.20 sold some last week comfortable riding this up to 6 bucks before I take more off. Buy this on a pullback and put in a stop at 3 bucks. You could catch a double by Q1 2011

Intraday 30 min chart I have a cost basis of 3.5 sold some last week got spooked in that spike down late Thursday on no news. I missed this break out, I have half a position left.

Buy at support around 33 and wait for launch. Stops below support. 
Cost basis 30 bucks. Looking to add.

This group is ripe for secular growth. With rising oil prices and the aging plants in the US look for this group to be strong for years to come. Also look at ETF (NLR)

Friday Recap; the week ahead

Expecting a pullback to 1195-1193 this week, raise cash!

As Friday early trade began the futures were headed lower until the payroll data was released at 8:30. Then the Labor Department reported that Nonfarm Payrolls rose in the month of October by 151,000. This was well above the consensus estimates for an increase of 55,000. The private sector (the household survey) showed gains of 159,000 jobs, which was again well above the estimates for 62,000K. September payrolls were revised higher to -41K from -95K. September Private Payrolls revised higher to +107K from +64K. The nation’s Unemployment Rate held steady at 9.6%, which was in line with expectations for a reading of 9.6%. And now the bad jobs news: There was a big jump in the duration of unemployed; but this market is enjoying bad news right now (Bad news is good news, more money printing) and rallying on it.

The Friday session began without a significant gap. Bulls moved in and worked the tape steadily higher for 90 minutes to put the high of the day on the chart at 10:55 am. Sellers were able to take the tape down to almost seven points below the high a few times throughout the day but were unable to hold it down as the index regained almost six points in the final 20 minutes.

The dollar was up almost 1% the market dipped a bit and then the dip was bought as is the case in the bull phase of this secular bear. 

Checking our Market Leaders shows us mixed results. But the interesting thing to take note of is the action of the Financial Sector (XLF). The XLF is simply on fire and carrying the SPX higher. We have mentioned several times over the last month to be alert for the XLF playing catch-up and how this could refuel the rally. 


The SPX gained 42.59 points during the week. The four week RSI of the four indices (SPX, Dow, NASDAQ, and Russell 200) is 94. Pullbacks often occur as this RSI reaches 80.

For the SPX, there were 422 components advancing and 63 declining. Total tick for the week was 654,000. The number of components with their 5 DMA above their 20 DMA increased during the week from a ratio of 2.61 to one to 3.6 to one.

On the NYSE, the advance/decline line increased greatly during the week and the 10 DMA of Net Advancing jumped from 133 to 468.

This week had the largest weekly increase since the week of July 6th and was the second largest increase of 2010. Looking back at past SPX data, weeks such as this happen a couple times per yet, at market short-term bottoms. Examples of such weeks other than bounces off of bottoms are difficult to find. The irony is that there were only eight ticks greater than 1000 during the week while there were 26 ticks more extreme than -1000. This divergence continues to suggest that institutional traders are taking advantage of the rally for distribution. 


Friday was just a day typical day after a huge run up day (in a bull phase); strong consolidation of the Thursday gains. We are seeing positive breadth with a strong advancing volume ratio. The number of bull to bears is extremely high, and stocks above 20dma is over 80% (usually a sell-off occurs at this point)


I am convinced that the market begins a pullback this week.  The technical indicators are all lining up and are at historically high levels (but they have been high all along, and if I am seeing it then everyone sees it and I think thats why we don't break down when we should have. There will come an even that no one sees coming that will take us out. There will be a significant draw down like 1999-2000 but I dont know when. So I am not shorting but I am aware and raised some cash last week.