Friday, December 03, 2010

Thursday Recap: A Look inside the markets


Overnight, the ECB left rates unchanged, which was expected and made no mention of new initiatives. The Labor Department reported that initial claims for unemployment insurance for the week ending November 27 rose by 26,000 to 436K. The week’s total was 13K above the Reuters consensus for a reading of 423K. Continuing Claims for unemployment for the week ending November 20 were above consensus at 4.27M vs. expectations for 4.203M and last week’s revised (higher) 4.271M. Futures were pointing higher as a result of the overnight economic data.

Technically there was no opening gap but the index surged higher several point in the opening minutes and carried through with nary a pause bringing the index up ten points by shortly after 10:00 am. The SPX then proceeded to drift higher throughout the day and close on the highs. It was another fun day for the bulls and not so fun for the bears.

For the SPX Index there were 428 Advancers/60 Decliners. On the NYSE 3,122 issues were traded with 2,151 advancing issues and 893 retreating issues, a ratio of 2.41 to one advancing. There were 279 new highs and 10 new lows. The five day moving average of New Highs is 123 while the five day moving average of New Lows is 17 and the ten day moving average of Net Advancing is 327. The Net Advancing data indicates a bullish trend.

Advancing volume was higher at a ratio of 5.65 to one. The closing TRIN was 0.43 and the final tick was 731. The NYSE Composite Index gained 1.43% today while the SPX gained 1.27%.

For the NYSE, relative to the previous 30 session average, volume was 8.47% above the average. Of the last 15 sessions 6 sessions ended with volume greater than the previous rolling 30 day average volume. Of the last 30 sessions, 19 sessions ended on a positive tick, 6 of last 10. For the SPX, the day's volume was 102.7% of the average daily volume for the last year. Volume was 128.2% of the last 10 day average and 108.5% of the previous day’s volume.

Another day of incredible breadth as New Highs continue to explode upward. Advancing volume more than doubled up on the advancing issues and the broad NYSE Composite Index outperformed the SPX. Back-to-back sessions with this type of breadth will most often lead to higher indices 30 days later.

Total tick for the day was 111,000 and the average tick for the day was 72. There were 32 ticks greater than 600 and 2 ticks more extreme than -600. There were no ticks greater than 1000 and no ticks more extreme than -1000.

Relative volume surged at today’s open but fell off throughout the day. The nightly breadth indicators were more bullish than we have seen recently but the advance/decline lines raise some questions and the McClellan Summation index has plenty of room for improvement.


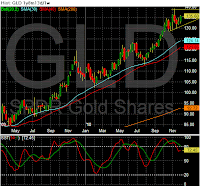
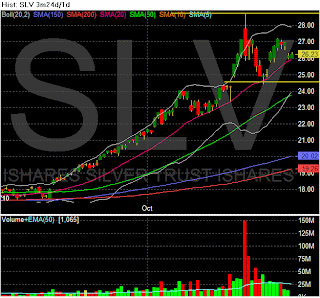
Basic materials, energy, financials (especially) , Healthcare, consumer discretionary  and utilities were strong today. Metals had a sell-off (off cliff like around noon, not sure what caused that. The DXY sold off yesterday and is down a tad this morning. See SLV, gold looked the same, daily and weekly charts look strong.


Waiting on non-farm pay roll numbers this am, SPX futures are up .4% so far, gold is off a bit. But as I had mentioned on Wed, we rally till early next week should take us to 1225-1230 and then start the next move down 1175 to 1165 first targets. 


I have made no changes in my portfolio. Up 16% in 8 trading days on RES but it looks too good to sell. I'm getting greedy now. I will take 25% off the table at 1225. 


Long SLV, GDXJ, GLD, RES, URZ, URA, UEC, TBT, RES, IRE, AIB.


Watchlist: CRUS, BWA

Thursday, December 02, 2010

Wednesday Recap: A Look Inside the market


Stock futures were pointing upward for a change on decent data out of China, a successful auction in Portugal, and a handful of decent reports here in the U.S. ADP reported that the private sector job market expanded again during the month of November. The report shows that private sector jobs rose by 93,000 jobs during the month, which was well above the consensus expectations for a gain of about 43K. October’s report was revised higher to a gain of 82,000 jobs, up from the initial report of +43K. In addition, the government reported U.S. Nonfarm Productivity in the third quarter rose by +2.3%, which was dead on with the consensus expectations for a reading of +2.3% and Q2’s unrevised level of +1.9% (Q1 was +3.9%). On the inflation front, Unit Labor Costs were reported to have fallen -0.1% versus the expectations for a decrease of -0.3%.

The midweek session began with a huge spike higher. The SPX was up nineteen points within five minutes and twenty-two points before 10:00 am. Then there was simple bullish consolidation within a tight trading range until just before noon when the index spiked upward several more points. The rest of the session traded within a tight range as the bulls that gave the bear no chance for an exit.

This session was bullish from start to finish; the small pullbacks were inconsequential. An oversold market got good news; the fuel for the rally came in overnight and continued through the ISM at 10am. I mentioned yesterday i see a bull close to the week followed by a pullback next week. We will probably test the 1225-1230  range and come back down.

The Market Leaders were the Russell 2000  and the SOX  that both set new 52 week highs. This is quite bullish; except for the action of the Financials (XLF). If the XLF begins to participate, this rally will easily set new 52 week highs. But without the XLF, I believe the tug-of-war trade continues (choppy trade , range bound market).


For the SPX Index there were 476 Advancers/12 Decliners. On the NYSE 3,147 issues were traded with 2,403 advancing issues and 676 retreating issues, a ratio of 3.55 to one advancing. There were 265 new highs and 10 new lows. The five day moving average of New Highs is 97 while the five day moving average of New Lows is 17 and the ten day moving average of Net Advancing is 264. The Net Advancing data indicates a bullish trend.

Advancing volume was higher at a ratio of 13.31 to one. The closing TRIN was 0.27 and the final tick was 581. The NYSE Composite Index gained 2.33% today while the SPX gained 2.12%.

For the NYSE, relative to the previous 30 session average, volume was 8.37% above the average. Of the last 15 sessions 6 sessions ended with volume greater than the previous rolling 30 day average volume. Of the last 30 sessions, 19 sessions ended on a positive tick, 6 of last 10. For the SPX, the day's volume was 98.9% of the average daily volume for the last year. Volume was 116.9% of the last 10 day average and 113.8% of the previous day’s volume.

Market breadth was outstanding and advancing volume absolutely blew away the advancing issues. The ten day average of Net Advancing exploded into positive territory. But the advance/decline line does not (yet) support today’s rally; there is a negative divergence that bears watching.

Total tick for the day was 100,000 and the average tick for the day was 64. There were 42 ticks greater than 600 and 13 ticks more extreme than -600. There were no ticks greater than 1000 and no ticks more extreme than -1000. The tick action suggests institutional accumulation.

Intraday volume spiked on the up moves today; there were buyers but few sellers. But the nightly breadth indicators are interestingly not as bullish as could be expected. The Absolute Breadth Index is suggesting a topping process. The McClellan Oscillator remains negative and the Summation Index continues to move towards zero. The breadth indicators should at least make bulls stop and think about the market internals.


The $DXY got resistance around the 200dma and has pulled  back. Probably will pullback below the 200wkma before next adavnce. This should allow the rally to continue to next week.


The Precious metals are in a good solid uptrend and will be nearing recent highs soon, expecting a pullback at that point.


As I wrote this will test 100 and fail, support at 200wk as seen before. If that breaks see previous lows in April.
Long TBT!!

Wednesday, December 01, 2010

Western financial business strategy

This explains the Western financial business strategy of breaking every law and paying a fine much less than you earned.
Posted by Jim SInclair
The Donkey
Young Paddy bought a donkey from a farmer for £100. 
The farmer agreed to deliver the donkey the next day… 
The next day he drove up and said, ‘Sorry son, but I have some bad news. The 
Donkey has died.’ 
Paddy replied, ‘Well then just give me my money back.’ 
The farmer said, ‘Can’t do that. I’ve already spent it.’ 
Paddy said, ‘OK, then, just bring me the dead donkey.’ 
The farmer asked, ‘What are you going to do with him?’ 
Paddy said, ‘I’m going to raffle him off.’ 
The farmer said, ‘You can’t raffle a dead donkey!’ 
Paddy said, ‘Sure I can. Watch me. I just won’t tell anybody he’s dead.’ 
A month later, the farmer met up with Paddy and asked, ‘What happened with 
that dead donkey?’ 
Paddy said, ‘I raffled him off. 
I sold 500 tickets at two pounds a piece and made a profit of £898′ 
The farmer said, ‘Didn’t anyone complain?’ 
Paddy said, ‘Just the guy who won. 
So I gave him his two pounds back.’ 
Paddy now works for Anglo Irish Bank.

Tuesday Recap: A look inside the market

Next target 1165, if that breaks than we test the 150dma
The session began much like Monday’s session; a significant and sharp move downward at the open. The index quickly put the low of the day on the chart just eleven minutes into the day, almost fourteen points lower. 1174 was successfully test yet again as bulls came charging in to buy the dip. But the high of the day was painted on the chart at 1:22 and the closing hours had a distinctive “sell the rally” feel about it. Bears manage to force the tape back into the middle of the daily range at the close.

Monday’s action, while quite similar early in the day, had a bullish feeling at the close. Today’s action, on the other hand, much less bullish as there was a give back toward the close. Yet here we are at 1180; closing above where we were ten days ago as the market gyrates intraday with a net result thats has been sideways.


For the SPX Index there were 131 Advancers/350 Decliners. On the NYSE 3,118 issues were traded with 1,003 advancing issues and 1,994 retreating issues, a ratio of 1.99 to one declining. There were 74 new highs and 28 new lows. The five day moving average of New Highs is 73 while the five day moving average of New Lows is 21 and the ten day moving average of Net Advancing is -133.

Declining volume was higher at a ratio of 1.72 to one. The closing TRIN was 0.87 and the final tick was 156. The NYSE Composite Index lost -0.7% today while the SPX lost -0.61%.

For the NYSE, relative to the previous 30 session average, volume was 48.09% above the average. Of the last 15 sessions 6 sessions ended with volume greater than the previous rolling 30 day average volume. Of the last 30 sessions, 18 sessions ended on a positive tick, 5 of last 10. For the SPX, the day's volume was 93.2% of the average daily volume for the last year. Volume was 107.6% of the last 10 day average and 110.1% of the previous day’s volume.

Declining volume continues to be lower than declining issues. The ten day average of Net Advancing does not suggest a deep pullback at all. We place a lot of emphasis on market breadth because it is usually correct; breadth does not yet suggest a deep pullback.

Total tick for the day was 20,000 and the average tick for the day was 13. There were 100 ticks greater than 600 and 105 ticks more extreme than -600. There were 8 ticks greater than 1000 and 5 ticks more extreme than -1000. This is about as balanced as the tick gets.

This continues to be a challenging market. We have support at 1174 which continues hold but with each repeated test odds increase that support fails. SPX was oversold, it bounced, and once again approaches oversold. This is often seen prior to a big move down. The next several days should make the market’s plan much more clear.


The $DXY had a turn around day, as it opened higher, put in a high of 81.30 and and closed at 80.80. It wouldn't surprise me after so many up days it takes at least a couple days breather. This will be positive for the markets. This morning the futures are up pretty nicely. Gold and Silver as well as other commodity names were up big yesterday. 


We have a bunch of economic data at 8:30 so the futures could get dinged a bit but I think we go up the rest of the week before the next leg down.


Tuesday, November 30, 2010

Monday Market Recap: A Look Ahead


Looking at the daily chart we see a hammer is printed as there was support at the 50dma but the close below the previous day's close and that is a negative. On the weekly chart you can see we closed below the 200wkma. So we seem to be in a sideways mode with ten up days and ten down days in the month of November. Bias is bearish (Technically)


Futures were strong overnight due to strong holiday shopping numbers, Asian markets responded positively and European markets were in positive territory.  This all changed shortly before the open as news from the UK came out showing that money supply is barely moving and a weak bond auction in Italy once again put traders back into uncertainty mode.

The week began with a significant move downward and the SPX moved ten points lower within four minutes of the open. The downward push continued almost unabated until putting the low of the session on the chart at 10:05 am, almost sixteen points down. Buyers attempted a rally which failed and the index tested the lows again just before noon. Then a successful test of the lows ensued which brought in buyers and put the bears on edge, the index surged to close fourteen points off the lows.


For the SPX Index there were 181 Advancers/301 Decliners. On the NYSE 3,131 issues were traded with 1,275 advancing issues and 1,747 retreating issues, a ratio of 1.37 to one declining. There were 64 new highs and 25 new lows. The five day moving average of New Highs is 71 while the five day moving average of New Lows is 20 and the ten day moving average of Net Advancing is -55.

Declining volume was higher at a ratio of 1.06 to one. The closing TRIN was 0.78 and the final tick was -21. The NYSE Composite Index lost -0.23% today while the SPX lost -0.14%.

For the NYSE, relative to the previous 30 session average, volume was -9.31% below the average. Of the last 15 sessions 5 sessions ended with volume greater than the previous rolling 30 day average volume. Of the last 30 sessions, 18 sessions ended on a positive tick, 5 of last 10. For the SPX, the day's volume was 79.9% of the average daily volume for the last year. Volume was 95.3% of the last 10 day average and 226.9% of the previous day’s volume.

Declining volume was milder than the declining issues; this is often a bullish sign. The ten day average of Net Advancing jumped from -330 to -85; this is basically neutral and certainly no longer indicates a bearish trend.

Total tick for the day was 49,000 and the average tick for the day was 32. There were 171 ticks greater than 600 and 91 ticks more extreme than -600. There were 15 ticks greater than 1000 and 8 ticks more extreme than -1000. The tick action suggests institutional accumulation.

Intraday volume spiked on the down moves early in the session yet also spiked on the late afternoon surge. The nightly breadth indicators suggest that we may have bottomed again today; we’re convinced we continue to see range bound trade, possibly with an upward bias.

Above 200wkma resistance coming at 200dma (81.7)
Tremendous move in the dollar since QE day


Materials, Precious metals, oil and miners were very strong yesterday despite and upward move in the $DXY. The $DXY is nicely above its 200wkMa. Interesting to see the afore mentioned group up along with the dollar. I'll be watching this dynamic carefully.


No change in my long term outlook for continued inflation, bursting of the bond bubble, a global debt contagion like the plague with China and India escaping most of the damage.


TLT found support at the 200wkma and is making a big move to the 150dma (Long TBT)


Long Gold, Silver, Uranium, short bonds, and picking my spots with individually strong stocks as time allows.


Have a great day everyone

Monday, November 29, 2010

$SPX: Long Term Double Top

Since the break of the 200wk moving average in 2008, we have been below that important average ( as some call it the mother of all moving averages). In April we tried to take that out and we couldn't. Recently we breached that line but only for a short while. This could be the double top that I am fearing in the US markets. I'm not a doom and gloom guy but there are people out there that are predicting some dire numbers for the DOW and SPX like Russell (Dow theory) Charles Nenner calling for 5000 on Dow, and Prechter Elliot Wave ( 7000). If you are long, all long maybe hedge with contr ETF's or raise cash, or keep an eye on the commodity stocks as the economic conditions worsen, more QE, and growing Debt in US and Europe become more a part of daily news it maybe too late at that point. Do your own homework! Dont fall in love with the mutual fund guys who come on CNBC and tell you that everything is great and they can make you money. I learned my lesson in 2008. Good Luck!

Current Positions: Technical Review

The dollar has been exceptionally strong due to problems in Europe, its break and the holding of the 200wkma has to be respected. This has been a powerful move to say the least. I don't expect gains in my commodity stocks until this reverses no position in Dollar but it effects everything I hold.

Closing position if we close below the trendline

Looking like a double top here going to sell half on a close below 20dma, and rest below the major support line.

I am weary of the dollar strength so I don't want to give up big gains, selling half  below 38 and rest below 36 support

Holding on to this one I got in on the GS call when it fell ten percent. Nice gain, sell stop 26.5

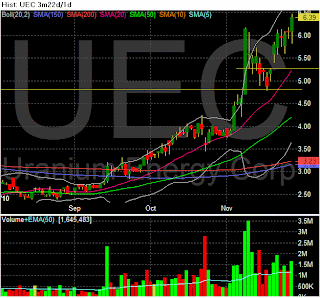
Uranium miners on fire since late September had a nice pull back, now on next leg up. Up almost 100% on URZ.

add on pullback to 5.25 to 5.50 range


add on pull back to trendline.


Holding 200wk ma support, oversold in terms of slow stochastics, resistance 200dma, may rally back to 150dma before next leg down, Long TBT which is the inverse of TLT, add TBT on any TLT strength close to 150dma

Friday Recap "A look inside the market"


The abbreviated holiday session began with a large downward gap and quickly put the low of the day on the chart eleven points down just three minutes into the day. A rally attempt ensued bring the index up seven points 45 minutes later but the bulls could not follow through and the rest of the session traded lower on very low holiday volume.


The SPX lost 10.33 points during the week. The four week RSI of the four indices (SPX, Dow, NASDAQ, and Russell 200) is 61. Pullbacks often occur as this RSI reaches 80 and bounces near 20.

For the SPX, there were 191 components advancing and 298 declining. Total tick for the week was 412,000. The number of components with their 5 DMA below their 20 DMA decreased during the week from a ratio of 3.75 to one to 1.36 to one. 

On the NYSE, the advance/decline line decreased slightly during the week -670 while the 10 DMA of Net Advancing increased from -319 to -207.For the SPX Index there were 60 Advancers/426 Decliners. On the NYSE 3,005 issues were traded with 949 advancing issues and 1,966 retreating issues, a ratio of 2.07 to one declining. There were 73 new highs and 13 new lows. The five day moving average of New Highs is 70 while the five day moving average of New Lows is 19 and the ten day moving average of Net Advancing is -207. The Net Advancing data indicates a bearish trend.


Declining volume was higher at a ratio of 4.42 to one. The closing TRIN was 2.13 and the final tick was -200. The NYSE Composite Index lost -1.04% today while the SPX lost -0.75%.

For the NYSE, relative to the previous 30 session average, volume was -58.63% below the average. Of the last 15 sessions 6 sessions ended with volume greater than the previous rolling 30 day average volume. Of the last 30 sessions, 19 sessions ended on a positive tick, 5 of last 10. For the SPX, the day's volume was 35.1% of the average daily volume for the last year. Volume was 38.9% of the last 10 day average and 49.9% of the previous day’s volume.


Total tick for the day was 66,000 and the average tick for the day was 43. There were 38 ticks greater than 600 and 19 ticks more extreme than -600. There were 2 ticks greater than 1000 and no ticks more extreme than -1000. The tick action suggests institutional accumulation.


Looking ahead to next week, it’s a busy economic calendar and the news from the Eurozone lend for market unpredictability. 


Market internals continue to hover around the neutral area suggesting continued range bound and choppy trade will continue for several more days as things sort themselves out. I still look for a second leg downward as part of this ongoing corrective cycle but I do not believe it becomes a significant correction until 1165 breaks.


No significant change in portfiolio and no change in long-term view (update this week)


Positions: RES SLV TBT GLD URZ UEC GDXJ small position in BGZ (trading around it, will add more if key supports broken on SPX) IRE and AIB