Friday, April 15, 2011

BRICS Take Aim at Dollar

The five BRICS nations took another step towards cementing their global influence on Thursday, calling for a broad-based international reserve currency system "providing stability and certainty".

In a statement released at a summit on the southern island of Hainan, the leaders of Brazil, Russia, India, China and South Africa said the recent financial crisis had exposed the inadequacies and deficiencies of the current monetary order, which has the dollar as its linchpin.

"The era demands that the BRICS countries strengthen dialogue and cooperation," Chinese President Hu Jintao said.

The BRICS are worried about the long-term fate of the dollar because of America's large trade and budget deficits. They also begrudge the privileges that come with being the leading reserve currency - hence the call for a revamped system that is more stable.


CNBC

Take Down Goldman Sachs…File Criminal Charges Already!

Excellent post from my friend at the Fundamental View

Some of you might have missed this but yesterday a scathing report was issued by a Senate panel in which it accuses Goldman Sachs of misleading clients and manipulating markets. The report also condemned greed, weak regulation and conflicts of interest throughout the financial system. Please tell us something that we didn’t already know.

Huffington Post: Goldman Sachs executives deceived clients in order to profit off the brewing financial crisis and then misled Congress when asked to explain their actions, concluded a top lawmaker who led a two-year investigation into Wall Street's role in the meltdown.
Carl Levin, chair of the Senate Permanent Subcommittee on Investigations, will recommend that Goldman executives who testified before his panel, including chairman and chief executive Lloyd Blankfein, be referred to the Justice Department for possible criminal prosecution, the Michigan Democrat announced Wednesday. Members of the subcommittee will now deliberate Levin's proposal.
The investigation found a "financial snake pit rife with greed, conflicts of interest, and wrongdoing," Levin said.
More than any other government report produced in the wake of the crisis, this account names names, blaming specific people and institutions: Goldman Sachs, Washington Mutual, Moody's Investors Service, Standard & Poor's, the Office of Thrift Supervision and others. It targets four types of institutions, all of which it says played key roles in causing the crisis: mortgage lenders that offered prospective homeowners booby-trapped loans; regulators that were paid by the institutions they were regulating and cooperated in widespread deception; rating agencies that gave seals of approval to products they knew to be especially risky, all in the pursuit of market share; and Wall Street banks that duped investors into buying securities that only the insiders knew were destined to go bad.
Levin said his investigators found 3,400 instances of Goldman officials using the phrase "net short" in the documents they reviewed. He intimated that Goldman likely used the phrase many more times in other documents not reviewed by his panel.
Asked about the general lack of prosecutions of high-powered Wall Street executives, Levin replied: "There is still time."
"Hope springs eternal," he added with a smile"

Link

How will we know when the QE2 trade is over?

I just found this article, it is worth a few minutes:

It’s about that time when the smart money is beginning to think 10 moves ahead in the chess game. And in this game, the only piece worth focusing on is QE2. QE2 ends on June 30th and traders are already jockeying for position. How soon will the QE2 trade end? No one can tell. It could be a sell in May or it could be a sell the news. But one thing will be very clear when it occurs – the US dollar will stage a counter-trend rally.

One of the primary fuels during this speculative fervor has been the decline of the dollar. With the exception of a brief period in November no sector has benefited more than commodities. As I have previously discussed, this hasn’t generated some great economic benefit for the United States (that wasn’t already occurring), but it most certainly has translated into speculative behavior.

The dollar’s decline was relatively benign until the ECB began forecasting rate hikes earlier this year. And the usual inverse correlation can be seen in a sizable Euro rally. The end of QE2 will be seen as a pseudo form of tightening and a step in the direction towards US rate hikes. This could be an excuse for short covering and a USD rally. And while that doesn’t necessarily mean the commodity bull market is over it is likely to put a dent in the QE2 trade.

Margin Requirements: Price of Silver

Great explanation of margin requirements at Comex and how they will impact Silver for the Newbie!

Link

Check this out (how did I miss this one)

Link


Silver Selling Off

JPM, FED, BLYTHE, and  'the coven', "releasing the hounds" !!

They have to start defending the Dollar here. It's falling off a cliff. I was hoping to take some AGQ off the table around 285, but the selling has started. time to take some off. Friday as been a big up day for silver in the recent weeks lets see if the trend holds 


Mike Maloney's New Video: Must Watch!


This guy is just absolutely brilliant. If you are new to metals investing. Go to youtube and take a look at his videos over the past few years. He has been right on the money all along.

VIDEO LINK

SILVER UPDATE


Silver has gained firm foot over the 41 dollar mark. It was purely awesome how the PM buyers defended the 40 level during the Mon-Wed raids, remember that Bloomberg report on the huge puts on the Silver. I told you it was JPM shenanigans and a million bucks of Monopoly money was a drop in the bucket.

Before I sound too 'Giddy', I will be taking some of the cream of the top of my AGQ's this am. Why, because I am way too over confident at the moment about my calls on the metals. I do think we get to 45 before we test 40. And if we do, do that. Then I don't think we don't 40 at all. 42 possibly, before the run to 50.

Long AGQ (STM TGT 290) Buy again in the 250's (if Lucky)


Uranium Miners Follow Up


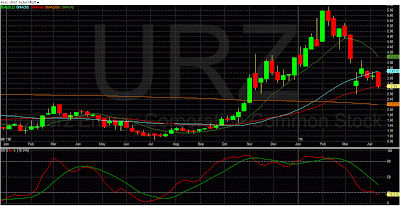
I got lucky yesterday with my call on the Uranium miners. They are off over 30% YTD. Read Yesterdays post and ease in. The dollar is tanking, oil will keep going higher, people are going to start screaming to Washington to do something about it. Solar and wind are so small they won't make a dent in terms of the energy we need. Plus there is global demand for Nuclear (Clean and Green). Long CCJ, UEC, URZ and STHJF.

US Dollar Sinking


Above is a weekly chart of the UUP, US$ ETF, it has formed an head and shoulders pattern and is now accelerating and may not complete until it hits 20. That will be a huge move. I have to admit I missed calling this pattern, I have been so focused on the metals and macro, i missed the chart.

For months now, I have been saying the dollar is in deep $h^t. The policies implemented by the Fed are not working, we aren't ever going to cut spending at least not till it's too late. I have been writing about protecting yourself (commodities and precious metals).

Taking the temperature of the average person in my day to day dealings, PEOPLE ARE OBLIVIOUS, it all these honest hardworking people that are going to be smashed (once again ) by government policies. In 08 most of us lost 50% of our net worth during the global market crash. Years of savings are gone. The debt crisis and dollar debasement will take out another 50% before its all said and done.


Digressing for a moment, I made a comment earlier about most people being oblivious as to the state of the nations economy, these are the same people who think that Owebama is sincere about cutting spending, and saving 4 trillion dollars. I have a saying I learned a long time ago, "don't listen to what people tell you, look at what they do". How does this apply to investing? The action is reflected in the price movement. Buying and selling, shows you what they are really thinking. The smart money is saying "we don't believe you Owebama". Or perhaps what he is planning isn't believable, or nearly enough or wont be in time to save the US from collapse. 

Most people have no idea how possible this really  is! The day (heaven forbid) the world gives up on the dollar or when they don't need dollars to buy commodities our economy will more than likely collapse. We'll probably default on our debt and go into depression.

These guys can  raise the debt ceiling all they want they will just keep killing the value of the dollar, until it's worthless


Oh by the way, the proposed budget cuts (like peeing in the ocean) will not make a dent in this overwhelming debt. If all of us were taxed at a 100% we couldn't pay for this years worth of spending.

Hey, and if you think I am full of $h^t just keep watching the chart (UUP), PRICE DOES NOT LIE. PEOPLE DO.

Keep watching Silver and Gold and Oil go up day after day. PRICE DOES NOT LIE.


S&P 500 Recap


Good morning. S&P futures are down slightly today. Well, it seems that I was wrong again with my short at the open AGAIN! Though I did't get stopped out yet I probably will today. 
Yesterday's session started with a big downward gap and further downside pressure over the next few minutes then found support between 1300 and 1305. The rest of the session we saw basically a five waves of buying with small pullbacks, with the largest pullback being about four points. There was some mild selling at the close on the SPX while the Russell 2000 was rising; this is usually a bullish for the following session. The SPX closed in the top 15% of the intraday range and this is often bullish for the next day as well.

Market Leaders, Metals (Silver & Gold had huge moves) Materials and energy outperformed, while Technology and the Financials (XLF) were both down. The Financials were down almost 1% while the Russell 2000 small caps were the U.S. leading gainer. Yesterdays volume was just slightly more than Wednesday's. Looking at the intraday pattern we can see a large spike of volume with the late morning decline and volume falling off during the afternoon rally. Today's rally was not being chased by traders. Checking the Breadth Indicators, things are a bit more mixed this evening. The McClellan Oscillator is moving back from oversold while the Summation Index continues to move lower. I'm thinking that the 1,000 area for the Summation Index is still obtainable but a bounce seems likely first.

New Highs were weak as is this weak rally from oversold condition and tomorrow needs to show some strength (Breadth & Volume).

38.8% of the SPX are above their five day moving average, 30.2% are above their 10 day average, 48.4% are above their 20 day moving average, 54% are above their 50 day moving average, and 83.8% are above their 200 day moving average.

The SPX 20 DMA crossed above the 50 DMA and this is an intermediate term bullish crossover. But there were four bearish crosses as the Russell Technology Index 5 DMA crossed below the 20 DMA, the Russell 2000 5 DMA crossed below the 20 DMA, the XLF 5 DMA crossed below the 20 DMA, and the SOX 5 DMA crossed below the 20 DMA.


I'm still short, probably get taken out today. 

Thursday, April 14, 2011

S&P 500 Recap: Breaking Down!

S&P futures are down 8 points to pre-open. Going short below 1310 on the SPX. MACD is bearish as well.


Yesterday's session began with a large gap high but once again the high of the day was painted in the opening moments as traders were immediately fading the gap. The SPX bounced significantly about forty-five minutes into the session but before 11:00 am sellers hit the tape again and hit it hard, taking the index down almost eleven points before 1:00 pm. After some sideways trading, traders hit the buy button and the last ninety minutes of the day were mostly a ramp higher as the SPX closed just a bit into the bottom half of the intraday range.

New Highs continue to be quite low. Declining volume was higher than advancing volume in spite of advancing issues being higher than declining issues. This is often a sign of weakness. But there are also indications of an impending bounce. Our guess is that we bounce and it provides an opportunity to fade.

Volume was lighter than Tuesday's. The intraday pattern shows a large dip in volume on the late morning rally followed by a spike in volume while the index sold off early in the afternoon. Volume then decreased in the afternoon as the market rallied. Looking at the Breadth Indicators we see consistently bearish looking indicators; something you wouldn't expect to see on a green close. But today's session traded more like a down day as the SPX lost seven points from open to close.


28.8% of the SPX are above their five day moving average, 27.8% are above their 10 day average, 48.4% are above their 20 day moving average, 53.6% are above their 50 day moving average, and 83.8% are above their 200 day moving average.


Uranium Miners Follow Up

Stochastics are oversold but not as bad as last July. You have the 200dma as support and to put in a stop, maybe 5% below that level. 

Stochastics are actually improving here. Not as oversold. Exit isn't as clear on the downside . Time to start small accumulation over time. 
Right at first Fukushima reaction, there was buying on that dip lets see if it holds,  lot of funds puking this up. Stochastics are very oversold. TIME TO BUY!

As you all know by now that the uranium prices were dropping a couple of weeks prior to the Fukushima Disater and the mining stocks have been beaten up badly as well. I continue to hold URZ and UEC both are off 30% this year but had givenvtriple digit gains last year. So it looks bad right now and gets worse with every earthquake in japan but we really have no options in the US but to move away from our coal and oil to produce power. Solar and Wind are unrelaible (can't count on the weather 24/7), we don't have the nat gas infrastructure, will take too much time to implement. The answer is nuclear energy. It's not a popular choice with 50% of Americans.

Here is a chart of what is used to produced energy in the US

650 Year Chart Silver: Some Perspective

For those of you who think Silver has gone Parabolic or that its too late to buy the metal here is a little perspective. We aren't even close to piercing the long term trend-line.  


Over night silver attempted to hold the 41 dollar level and has since sold off 34 cents. As you know we have had multiple JPM raids this week and the PM buyers have been very busy at the 40 dollar level. Buy at 40 and take a little off at 45. 

TKRFF @.66 : Headed to 3


The last couple of days have been awesome entry points into Tinka. I know there is a lot of interest in this stock because I see the clicks on the Tinka posts so I wanted to write a little about this pattern. To me this stock looks like its in a stair-step pattern and each move is giving tremendous gains as long as you buy it close to the 20dma. This is a very strong pattern and will repeat. I know it sounds too easy, believe me its not going to be. Thinly traded stocks will get knocked about intra-day and you'll get scared out. So buy a small amount you don't have to worry about day and night. In this last sell off (Tuesday) I was lucky to add a small amount at .60. I will hold that new buy until the old resistance is taken out. Then I will wait for the next sell off and use that money and whatever profit I make to buy back. This process takes patience and especially if you are new to the game, its difficult. In any case, this company has great prospects see video and previous posts, technically its awesome and so are the fundamentals for Silver. I think we are headed to 3 dollars a share in this before year end if it isn't acquired around $1.5.


Wednesday, April 13, 2011

Inflation Actually Near 10% Using Older Measure


After former Federal Reserve Chairman Paul Volcker was appointed in 1979, the consumer price index surged into the double digits, causing the now revered Fed Chief to double the benchmark interest rate in order to break the back of inflation. Using the methodology in place at that time puts the CPI back near those levels.
Inflation, using the reporting methodologies in place before 1980, hit an annual rate of 9.6 percent in February, according to the Shadow Government Statistics newsletter.

Since 1980, the Bureau of Labor Statistics has changed the way it calculates the CPI in order to account for the substitution of products, improvements in quality (i.e. iPad 2 costing the same as original iPad) and other things. Backing out more methods implemented in 1990 by the BLS still puts inflation at a 5.5 percent rate and getting worse, according to the calculations by the newsletter’s web site, Shadowstats.com.

Here is the link to the full article.

GREAT POST by Turd Ferguson

I recently found this blog by a guy who calls himself Turd Ferguson. I think it should be on everyone's daily read list. That is if you really care about investments, future and want to cut through the garbage on CNBC, Bloomberg and the like. The guy has an excellent writing style to boot.

Here is his latest post, its worth the time!
 link

SPY Hanging on

Almost pulled the trigger on the short. Right at the lows. Gotta be patient here so as to not get run over like every other time. I stepped in front of this train.

RES

This is my favorite oil stock to trade. I have made money a few times on this one. Its had a nice pull back, good entry point, stop out 5% below purchase , 
Long RES at 22.10

SPY breaking down

Looks like the spiders might have put in the high for the day in the pre-market. Opening a small short position if we don't hold yesterday's low


TKRFF: Tinka Resources

Some poor guy just filled an order, bid TKRFF 15% from yesterday's close. Very small volume right now or maybe it was an insider. Will follow up on this move. Also can you see the stair step pattern it seems to correct to the 20dma or a bit below before a protracted advance. 

TTM: Next Stop 30

up 10% on this trade already, its got a long way to go, my target is 36, but short term we break to 30, little resistance there, slow steady climber. Emerging markets will out perform US equities. So if the S&P keeps going down it will pull everything else down but on a relative basis EM's will hold price.  

Long Bond Call: Best Ever

 I don't usually toot my own horn but although this trade hasn't been as hugely profitable for me as Silver has, but I have seemed to called the exact bottom in the TBT (Inverse of the long bond ETF). See from my previous posts as to point of entry. And its not too late to get in this one, this will be a multi-year hold. Also if you have a couple of minutes and read this post by Dan Norcini,  regarding bond market (Goldman Sachs) manipulation. No, not conspiracy theory stuff. This is real simple stuff to do if you have connections.

AGQ (Silver)

Lets see what Blythe has in store for Silver today.  If we can breakout above that first line will add to AGQ and take profits on the way up above 265. So far 40$ (physical Ag) is showing good support. As always watch the downside more than the upside. Preserve capital! 

OIL

Buying this at the open target 30, put in a stop 27.5


edit: 9.38am OIL filled at 28.21

S&P Recap and A Look Inside the Market

The Tuesday session opened with a significant gap lower and quickly bounced a few points before taking a nine point ride to put the low of the day on the chart just before 11:00 am. The middle part of the session was a sluggish slow creep higher that accelerated a bit to the upside mid afternoon but the final ninety minutes volume increased and sellers pushed the index down until a modest bounce during the final half hour. The trading range was barely more than nine points today and the SPX closed right in the middle of that range.


SPX found support at the 20dma, and if that breaks we will most likely test the recent lows. S&P futures are up 8 points as of this morning, its see if the open is faded. I didn't short yesterday, but I will if we take out yesterdays low. 

Declining volume was not particularly bearish but New Highs plunged. The ten day average of Net Advancing moved into negative territory while the NYSE Composite was weaker than the SPX. The TRIN is not yet calling for a bounce.Today's volume ticked higher. 


The intraday pattern clearly shows a volume spike along with the morning sell-off, as well as a volume spike late afternoon with the sell-off. Checking the Nightly Indicators we see that the McClellan Oscillator has surged into oversold territory while the Summation Index has made the expected move lower. The Indicators look pretty bearish.

15.4% of the SPX are above their five day moving average, 22.6% are above their 10 day average, 48.2% (it was 80% plus a few days ago) are above their 20 day moving average, 52% are above their 50 day moving average, and 84.4% are above their 200 day moving average.

This is amazing that we have only lost a few points on the averages yet individual stocks are acting very poorly. This isn't good folks. 

Action: Do nothing, too much downside risk, upper band of resistance 1340's. If you have profits protect them, hedge, take some off the table. 

Tuesday, April 12, 2011

Major Distribution Day for Silver ETF's

Huge volume last two days in the  SLV,  77million on day of reversal and 68 million on this distribution day. Looks like we are in for more selling, probably till late Friday. 
Almost 2x normal volume and a minimal loss equals distribution, and thats not bullish short-term. Looking to add around 244. 

AGQ (Silver)

Notice the HNS pattern on the intra-day chart, it's now completed and starting to form another one. I am hedging with another buy of the ZSL. I am extremely bullish on Silver (see checklist) all systems are go but there is a global interest in keeping the price of gold and silver down, in order they won't be able to stop price from going higher they just want to slow down the pace of the ascent. Inn the mean time as they put the screws to the longs, it nice to take some off the table and or hedge. It helps me sleep at night.

KING DOLLAR: EUR DOLLAR up 8% in 2011

Just keep printing more money! 

SPY: Inverse HNS

Anyone else see what I see. Inverse HNS is building, futures are down this morning but  as we have seen that every dip is a buying opportunity, so keep an eye on this, it could be a big move up

Goldman: Risk Off, Short-Term

Traders’ wariness towards growth plays was compounded by news that Goldman Sachs had advised clients to lock in profits on oil and other commodities as they looked vulnerable to a short term correction.

The bank’s comments seemed to hit a nerve in a sector that many saw as vulnerable after many months of strong gains and very high levels of “long” speculation.

Crude oil fell back from a fresh cyclical high of $113.46 a barrel, losing 3.5 per cent on the session. On Tuesday, West Texas Intermediate is little changed at cents at $108.93.

Precious metals were particularly hard hit by the Goldman-induced selling. Silver had hit a 31-year high of $41.93 an ounce but fell back at one point to $39.75, a 5.2 per cent reversal. The grey metal is currently at $40.72, outperforming gold, which is off 0.3 per cent at $1,462 an ounce after hitting a record $1,476 on Monday.


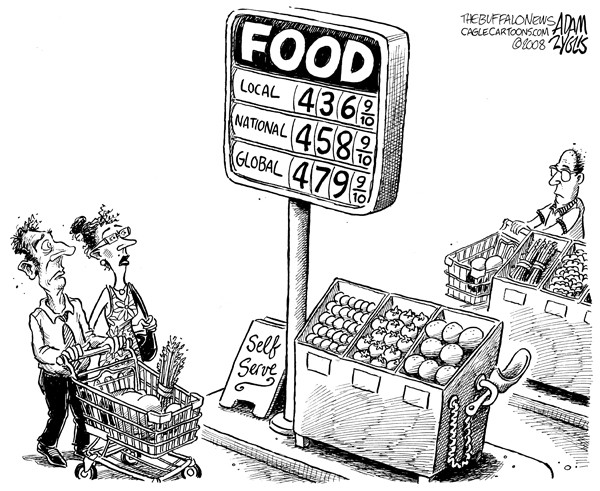
Inflation is here to stay!

Consumers were being braced for more pain today after a report revealed that factory gate prices rose at their fastest rate since October 2008.

Manufacturers increased their prices by 0.9% between February and March, leaving them 5.4% higher than a year ago, as they passed on the soaring cost of oil, food and other commodity prices, according to the Office for National Statistics.

This led to record annual prices hikes for paper products, clothing, textiles and leather in March, while food was up 7.4% year-on-year in its biggest hike since January 2009.

The higher-than-expected rate of factory gate price rises was announced the day after the Bank of England resisted pressure to hike interest rates from its record low of 0.5% in a bid to beat down inflation.

Today, oil prices hit fresh two-and-a-half-year highs after fierce fighting in Libya damaged the country's largest oil field.

Brent crude was up 1.4% to 124.2 US dollars a barrel as motorists were warned that the price of petrol at the pump is likely to rise and is set to further squeeze consumers' disposable incomes.

Manufacturers are being forced to increase their prices to their customers after their input costs rose 14.6% year-on-year, although this is slightly down on February's record high of 14.9%.

S&P Recap and A Look Inside the Markets


Yesterday:
  • earthquake rocked Japan and shook buildings overnight. European markets opened mixed to slightly lower. 
  • concerns about rising metal prices 
  • mixed corporate results were pitted against continuing merger and acquisition activity 
  • Libyan leader Gaddafi had agreed to a ceasefire proposal from the African-Union. 
  • Stock futures were pointing to a modestly higher open. 
Intra-day action:The session began without a significant gap and moved higher for twenty minute but yet again put the high of the day on the chart very early in the session. We continue to see a pattern of early morning highs. This is a characteristic of pullbacks, not rallies. But in spite of that, the market continues to close off the lows as well although today's close barely finished above one quarter of the intraday range. Bounces were weak the entire session but the indices continue to be resilient.

losers today were the chip makers (SOX) and the small caps (Russell 2000.) The broad NYSE Composite underperformed the S&P as well. This continues to appear like the beginning of a pullback, but as you know I have been proved wrong a many times, as QE trumps TA.


For the S&P Index there were 197 components advancing and 280 components declining. On the NYSE 3,156 issues were traded with 904 advancing issues and 2,141 retreating issues, a ratio of 2.37 to one declining. There were 110 new highs and 16 new lows.

Declining volume still remains unconvincing. But the repeated early morning highs followed by selling are a clear pattern of discontent with this level.

Today's volume was lighter than Friday's volume. Bears really need to get some volume going in order to be convincing; there simply is no panic. But the intraday volume pattern clearly shows spikes in volume with each S&P down move and drops in volume with each up move today; this is a bearish pattern. Checking our Breadth Indicators we see even more bearish consistency among the data tonight. We will be watching the McClellan Summation Index closely over the next several days, watching for it to fall to the 1000 area.

21.4% of the S&P are above their five day moving average, 35% are above their 10 day average, 63.8% are above their 20 day moving average (dropping steadily), 62% are above their 50 day moving average, and 85% are above their 200 day moving average.

Sectors stronger than the S&P for Monday:
- Financials -- Outperformed by +22%.
- Industrials -- Outperformed by +20%.
- Technology -- Outperformed by +13%.
- Consumer Staples -- Outperformed by +81%.
- Health Care -- Outperformed the by +85%.
- Consumer Discretionary -- Outperformed by +31%.

Sectors weaker than the S&P for Monday:
- Basic Materials -- Underperformed by -83%.
- Energy -- Underperformed by -174%.
- Utilities -- Underperformed by -116%.


Range bound market. I'm going long over 1340, short if 1320 breaks. We are right at support. Good entry if you want to go long (if thats your bias) you can put in a stop a couple percent below, and if we make it to 1340 you can take a profit there. This is a very small range though so depends on the need to trade or having some patience. 


edit: Stock index futures pointed to a lower open on Tuesday, with futures for the S&P 500, Dow Jones and Nasdaq down 0.4 to 0.6 percent at 0903 GMT.

* Investors are likely to be cautious after Japan raised the severity of the nuclear accident to the highest level, putting it on par with the Chernobyl 1986 disaster.


Silver Holding 40

Live 24 hours silver chart [ Kitco Inc. ]

As I mentioned yesterday someone made a big bet against SLV by buying a million bucks worth of July puts (25 strike price). The sheeple got nervous and pucked up Silver from their nervous twitchy little hands.


Ever take an oral exam, NO, NOT LIKE AT THE DENTISTS OFFICE.


You know when an examiner (professor/teacher) asks you questions in school. Remember when you spoke confidently it was because you had studied and were sure of the answer. The people that puke and shake, they didn't study, they are not confident, they speak by running away (Sheeple don't do homework). They buy stuff because they heard something on CNBC or from Joe or Bill or Bob. Really, who has the time for homework. How am I so sure this kind of stuff happens, I used to do it all the time. It's out of FEAR!


I'm not knocking selling anything for a profit (no one gets poor taking a profit), sell for the right reasons.
I'm going to make a checklist as a reminder for me and anyone else playing along. This will serve to remind me of the fundamental reasons why I am long Silver.


Here's to holding the important 40. next level lower 38.2 (I'd love to get more at 38) We need Blythe help to get there though.


Long AGQ (bought a small amount right before close)
Sold some ZSL yesterday (half left) Just a hedge (we went up through 40 really fast)


This from Harvey: " I would like to report that silver is in slight contango up until May 2012 and then it goes into backwardation. The lease rates are negative from zero to 3 months then racket up to positive from 6 months and one year.

The total silver comex OI continues to rise sending our bankers into a tizzy. The open interest reading for today which is basis Friday night was 144,923 from 144,647. Silver had an outstanding day on Friday rising over a dollar to close at $40.60. The open interest should have had a higher reading so we probably lost a few more bankers who covered a tiny fraction of their massive shorts.

With silver rising to $42.00 in Europe early this morning, we probably saw more short covering from European banks. The demand for physical silver is relentless. The front options expiry month of April mysteriously saw its OI rise from 13 to 32. The next front month of May saw the OI fall from 69,555 to 67,178. This is quite normal as we start approaching first day notice.

The estimated volume today at the silver comex was a mind boggling 94,419 contracts. The confirmed volume on Friday was 77,844. So it looks like the bankers used all their firepower in knocking silver down from stratospheric heights. The bankers are losing massive dollars due to their huge short position".


Monday, April 11, 2011

Big Bet Against The SLV

"A Trader", thats so funny to me. Bet a million, ten million whatever, its free money they get from the fed, its like me giving money to my kids at skee ball, I don't really expect them to bring home a valuable prize. This is more of the same BS. This isn't a legitimate bet just another way for Blythe and the Coven to scare sheeple, and it works on the weak hands. I would not worry about silver based on the options market, this isn't like shorting CSCO's earnings for the next quarter. The Chinese, Japanese and Indians will buy any dip. The only way they are going to break Silver is if they co-ordinate an attack with other Central Banks. I don't think the rest of the world is going to play along. Just a hunch.

Bloomberg reports: "A trader’s almost $1 million bet that an exchange-traded fund tracking silver will plunge 37 percent by July was today’s biggest single options trade on U.S. exchanges as futures on the metal reached a 31-year high. The 100,000 options to buy 100 shares each of the iShares Silver Trust (SLV) at $25 by July changed hands at the ask price of about 10 cents and exceeded the open interest of 6,054 outstanding contracts before today, indicating that a buyer of a new bearish position initiated the transaction. The ETF rose to the highest intraday level since trading began five years ago, $40.33, before erasing gains. It fell 0.5 percent to $39.67 at 12:54 p.m. It hasn’t closed below $25 since November."

OWEbama Flip Plop


Five years ago, a new U.S. senator from Illinois (OWEbama) voted against raising the limit on how much debt the federal government could issue. He said it would be a " big mistake ".
“Increasing America’s debt weakens us domestically and internationally,” the senator said at the time. “Leadership means that ‘the buck stops here.’ Instead, Washington is shifting the burden of bad choices today onto the backs of our children and grandchildren. America has a debt problem and a failure of leadership. Americans deserve better.” Read the senator’s full remarks.
President Barack Obama, as it turns out, now believes his vote in 2006 was a mistake, according to White House spokesman Jay Carney.
Seriously!?!
raising the debt ceiling is so important to the health of this economy and the global economy
But what about the children and the grandchildren B?
I guess we just continue with our Ponzi scheme and hope all our creditors don't all cash out at the same time.


article: Link


Best Currency Forecasters Say Dollar Weakness to Persist as Fed Stimulates


  • The most-accurate currency strategists see no recovery for the dollar in coming months
  • Wells Fargo & Co., the top forecaster for the second straight quarter, and No. 2 St. George Bank Ltd., say America’s currency will be little changed through June
  • the dollar will keep falling after its weakest start to a year since 2008
  • “The U.S. would like to keep interest rates as low as possible for as long as it can.”


FED SAYS INFLATION "FO GEDA BOUT IT"

I guess if you were worried about the money store closing, you can now rest easy. "Party On Wayne"!


“The surge in commodity prices over the past year appears to be largely attributable to a combination of rising global demand and disruptions in global supply,” Yellen said today in a speech in New York. “These developments seem unlikely to have persistent effects on consumer inflation or to derail the economic recovery and hence do not, in my view, warrant any substantial shift in the stance of monetary policy.”


Yellen used the word “elevated” four times in her speech in referring to the 8.8 percent jobless rate. She used “transitory” five times in referring to the effects of commodity prices on broader inflation, the same word the policy- setting Federal Open Market Committee used in its March 15 statement.


Full Article


Silver Profit Taking (reversal)

Live New York Silver Chart [ Kitco Inc. ]

Silver Reversal, we hit a high at 130am of 42/oz and we are now at 40.66. Lets see if the 40 level holds, if not look to re-accumulate at 38.5 to 38.2

S&P Recap and A Look Inside the Markets

News for the week: 
1. China's PMI came in above expectations.
2.  European PMI reports was weak, but showed economy growing.
3.  U.S. The Labor Department reported that Nonfarm Payrolls rose in the month of March by 216,000. 
4. The private sector showed gains of 230K jobs, which again was above the estimates. 

The first session of the quarter began with a significant gap higher, moved higher for a few minutes then quickly sold off several points. But before 10:00 am the S&P began to climb higher and moved about eight points upward putting the high of the day on the chart at 11:36. Most of the next three hours traded sideways with a slight negative bias but before 3:00 pm sellers arrived and took the index down sharply seven points. The final forty-five minutes of the session bounced but it wasn't a particularly strong bounce. The index closed just above one third of the intraday trading range.


Weeks Highlights: Market Topping


early session highs and late session lows
Only once this week was the high in the afternoon 
All five days the low came later than the high
Three times the high came in the opening minutes and then sold off. 
Type of action is typically seen during a topping process

  • Friday's volume was light but we can see one huge spike in volume late in the day when the indices sold off sharply. This is a bearish, lets see a trend develop first before we get too excited.


  • No Panic in this market: Breadth was even weaker than the small losses would have suggested. There is a lack of new lows and new highs still doing nicely. 


  • 29.4% of the SPX are above their five day moving average, 47.3% are above their 10 day average, 73.4% are above their 20 day moving average (we got as high as 82 last week), 65% are above their 50 day moving average, and 86.2% are above their 200 day moving average.


Sectors stronger than the S&P for Friday:
- Energy -- Outperformed by +76%.
- Consumer Staples -- Outperformed by +21%.
- Utilities -- Outperformed +7%.
- Health Care -- Outperformed by +41%.

Sectors weaker than the S&P for Friday:
- Basic Materials -- Underperformed by -28%.
- Financials -- Underperformed -49%.
- Industrials -- Underperformed by -67%.
- Technology -- Underperformed by -17%.
- Consumer Discretionary -- Underperformed by -17%.

Fundamentally, I am bearish on this market, but its going to keep going higher as cheap money is finding a home in stocks. And as always, you have to trade the market you see in front of you and not make predictions and I have been guilty of not following my own advice. I have tried to step in front of this market a few times and have been run over. Right now, I am neutral, but if we break out above 1340's, will go long. I hope we can pullback to recent lows but Mr. Market usually doesn't give you gifts.  Here is a link to my favorite book on making money in the stock market. Its also very easy to read if you are new to markets.