Wednesday, December 08, 2010

Gold and Silver Action 12/6/10

Posted By Dan Norcini:

Silver was the star of the precious metals complex today as it shot higher in the face of a stronger Dollar and a mixed performance by the overall commodity sector. Its strength helped to pull gold higher particularly when it cleared $30 for the first time since many moons ago. 
I have been receiving emails from some detailing the efforts to squeeze Morgan. If you track the daily open interest figures without looking at the larger picture, it can be oftentimes a bit unclear as to what is going on, mainly because the actions of spreaders can cloud the short term picture. It is revealing, however, when you look at the weekly silver chart and compare that to the COT chart over the same timeframe.
The big commercial-end user- producer class peaked its net short position in early September as did the net long position of the managed money (hedge funds). Since that time silver has rallied nearly $9 excluding the last few trading days (Monday included). Yet the net short position of the big commercial class has been steadily dropping while the net long position of the managed money class has been moving lower. Only in the last two weeks has this process been halted with a reversal in the size of both the net short commercial position and the net long managed money position. Ditto for the other class known as the Swap Dealers.
Apparently there has already been some sizeable short covering occurring in the Comex silver market that only recently has come to an end as the three groups mentioned above have gone back to their normal status quo. One group of buyers has been operating somewhat under the radar screen and that is the class known as the other reportables. These are large traders such as private individuals or locals or sometimes CTAs. They have been steadily buying since $22 and as of yet show no sign that they have had enough. While not the largest force to contend with in the market, they are also not to be ignored. Those who trade in reportable size in any market are generally not your typical, uninformed speculator but are those who tend to know their market fairly well. After all, large private traders are not risking client money – they are risking their own and that makes for no tolerance towards ignorance.
Oddly enough, it is not the small speculators who are in there buying. They have been steadily selling out the last few weeks even though overall as a group they remain as net longs.
What appears to have happened is that some of the large shorts apparently did not decide to roll to March on out shortly after they began exiting in front of the delivery process for the now-expired September contract. They seem to also have been hesitant to carry some of their December silver short positions. They might have opted to get out of the December earlier than normal to avoid some delivery pressures and then sat on the sidelines waiting for price to move higher before plying their craft of establishing new shorts once again. It also helps them avoid having to deliver if they avoid the front month.  If that is the case, it explains the air pockets above the market which thus far have allowed Silver to shoot higher so rapidly.
What I am particularly interested in seeing now is whether they will attempt to rebuild the size of that short position or will look for ways to draw it down further. Based on what I can see of the last few days worth of open interest, they are adding to, not drawing down shorts. How this plays out is going to be extremely entertaining especially now that the metal has pushed to the $30 level. For guys who think watching prices change second by second is exciting this is all rather novel. For normal folks, what this simply means is that we have already seen what silver can do when it is experiencing some significant short covering. If it gets another round of this… well you can fill in the blanks based on what has been occurring. One thing is certain – more than a few call option writers have gotten slammed.
I mention all this because it is having an effect on the gold market. There are some guys playing the silver/gold spread and leaning on gold a bit as they load up on silver. Even at that, gold is still moving higher but it cannot yet clear its former all time high in US Dollar terms and move past that. It has however bettered its all time high in terms of both the British Pound and the Euro and continues moving strongly upward in terms of the world’s major currencies including the Yen where it is at another fresh 27 year high lacking only a relatively small gain before it posts a 29 year high. Once again gold is sending signals that there is a great deal of nervousness towards paper currencies globally.
It needs to clear resistance above $1420 to push on up towards $1440. There are a few bearish divergence signs but that is normal after a period of consolidation after which a market shoots rapidly to a new high. Bearish divergence signs mean nothing if they are not accompanied by a breakdown in price below a support level. This gold has not done. That being said, gold needs to continue to push higher in US Dollar terms to keep the technically-driven momentum funds from casting away their fleeting allegiance to the yellow metal. Initial support lies down near $1384-$1380 followed by better support close to $1,365.
The Dollar is higher today – YAWN!  The Euro is lower – YAWN again. Big deal. It has become a game of what is worth less than the competitor. Both of them stink as does the Yen which more and more investors are wising up to and is the reason behind the strong climb higher in gold.
Bonds are higher today because Bernanke is worried about the economy. What a shock! Who would have ever dreamed that? Sure sounds like a great reason to buy more paper IOU’s especially given the fact that Ben said he could always buy even more of them if QE3 were needed.
Crude oil looked like it was going to make a run past $90 at one point in the session today but it faded from its best levels and is down a bit as I write this. It still looks to me like it has intentions on that level, however. We’ll see.
The HUI is outperforming the broader S&P 500 but it needs to get through 590 and leave that in the past for another leg higher. Trapped shorts are praying for a double top but would need a close way down below 530 to have a realistic shot at that.
Wheat keeps moving higher with weakness in corn and the beans pulling it back a tad. Palladium was down today but is trading above $750 which is amazing considering the fact that it was trading at $424 at the end of June this very year.

Addendum; Gold and Silver fell hard in mid and especially late day of trade-Ross

Tuesday, December 07, 2010

Multi year chart NDX, Break out???

V Bottom, undeniable! Recent Cup and Handle on the daily charts
Inverse HNS with Break out possible, if you take out the 07 resistance!!!

Monday Market Recap: A Look Ahead


$DXY is below the 200 wk ma and that is a significant reversal from what we had seen recently, this will fuel the fire in equities and we are seeing that with morning futures up nicely. Metals and Miners also benefiting! The SPX looked like was putting in a triple top until I woke up this morning to find the futures up and over that 1230 level, market needs volume and a hold above the April highs. The QQQQ's are in a cup and handle pattern and this leads me to think that there is a lot of room to upside and we are not going to top here. SPX is just starting to build the same pattern. Its been lagging due to the Financials, so I'll be watching that group. 

The week began with a little downbeat mood as Ben Bernanke wasn't exactly upbeat about the economy in his "60 Minutes" interview. In addition, debt spreads are widening once again in peripheral Europe. There was talk again this morning about countries such as Ireland and Germany abandoning the Euro in the future. The economic calendar had no data scheduled for release today and things are quite slow for much of the week.

The Monday session opened with about a two point gap downward. The low of the day was quickly on the chart at 9:54 am and a rally attempt was tried but went nowhere. The lows were tested just before noon and bulls once again took control of the tape pushing the index to the high of the day at 3:43 pm. The final quarter hour saw a two and half point "sell off" but that minor move took the index below the midpoint of the intraday range because the range was so small.

Looking at the Markets Leaders we find a mixed board that is mostly down, with the exception of metals and miners the Russell 2000 (small caps) finished a bit higher. 


For the SPX Index there were 174 Advancers/272 Decliners. On the NYSE 3,119 issues were traded with 1,501 advancing issues and 1,509 retreating issues, a ratio of 1.01 to one declining. There were 260 new highs and 8 new lows. The five day moving average of New Highs is 158 while the five day moving average of New Lows is 13 and the ten day moving average of Net Advancing is 157.

Declining volume was higher at a ratio of 1.1 to one. The closing TRIN was 1.09 and the final tick was 298. The NYSE Composite Index lost -0.14% today while the SPX lost -0.13%.

For the NYSE, relative to the previous 30 session average, volume was -21.89% below the average. Of the last 15 sessions 6 sessions ended with volume greater than the previous rolling 30 day average volume. Of the last 30 sessions, 20 sessions ended on a positive tick, 6 of last 10. For the SPX, the day's volume was 76.8% of the average daily volume for the last year. Volume was 87.8% of the last 10 day average and 93.7% of the previous day’s volume.

Today’s action was exceedingly mild (unless you are in the precious metals arena) and appears mostly neutral. But the ten day average of Net Advancing continues to creep lower.

Total tick for the day was 100,000 and the average tick for the day was 65. There were 27 ticks greater than 600 and 12 ticks more extreme than -600. There were no ticks greater than 1000 and no ticks more extreme than -1000. The tick action suggests institutional accumulation.

The tick action requires a comment. The last four sessions have seen some of the "softest" tick action in recent memory. Extreme ticks have virtually disappeared; we have gone four days without a tick more extreme than 1000.

Intraday volume today was somewhat heavy at the open, then fell off dramatically. The only bump in volume of any minor significance came during the test of the lows just before lunch hour. Looking at the breadth indicators, things are more mixed than they have been the last couple of days. The 10 DMA of the McClellan Oscillator has yet to move into positive territory and the Cumulative Volume Index isn't acting particularly bullish.

Everything is up this morning, Metals, Industrials, Materials, Financials doing well, long bond is getting hit as is nat gas (what else is new). 

Have a great day.


Monday, December 06, 2010

Friday Recap "A look inside the market"


Foreign markets were mixed in response to China announcing it was shifting to a "prudent" monetary policy. The Labor Department reported that Nonfarm Payrolls rose in the month of November by 39,000. This was well below the consensus estimates for an increase of 149,000. The private sector (the household survey) showed gains of 50,000 jobs, which was also far below the estimates for 156,000K. The nation’s Unemployment Rate spiked to 9.8%, which was above the expectations for a reading of 9.6%. Stock futures reversed course on the news and pointed to a lower open.

The Friday session began with a small downward gap but to the dismay of the bears the low of the day was painted within opening moments. After a couple of hours of tight range choppy trade the low of the day was successfully tested just before lunch hour and from that point onward the bulls ruled the tape pushing eight points higher off the lows to close near the highs.

This was another huge disappointment for the bears as the employment data was bleak yet traders shook off the bad news and routed the bears. After two successive days of more than 1% gains, the market still was able to rally on bad news. This is a characteristic of a bull market and not a characteristic found in bear markets. During bull markets, as mentioned here previously, your best and most reliable buy signal is any pullback.

The SPX gained 35.31 points and its no coincidence that the dollar was weak during the same period of time. The four week RSI of the four indices (SPX, Dow, NASDAQ, and Russell 200) is 77. Pullbacks often occur as this RSI reaches 80 and bounces near 20.

For the SPX, there were 436 components advancing and 50 declining. Total tick for the week was 416,000. The number of components with their 5 DMA above their 20 DMA increased during the week from a ratio of 1.36 to one under their 20 DMA to 2 to one above their 20 DMA.

On the NYSE, the advance/decline line increased significantly during the week by 2,262 and the 10 DMA of Net Advancing jumped from -207 to 214.

The weekly chart painted a bar that closed above its Bollinger Band. This last happened the week of November 5th. The December monthly chart bar is also at the top of its Bollinger Band as the recent rally has stretched out all of the oscillators.

The weekly range was 4.37%; this range is a bit unusual and somewhat more common on a down week. During 2010, weeks with greater than a 4% range that were up weeks were most often followed by down weeks, some of which were quite significantly down. The most recent 4% range up week was the week of November 1st.


For the SPX Index there were 304 Advancers/180 Decliners. On the NYSE 3,130 issues were traded with 1,875 advancing issues and 1,135 retreating issues, a ratio of 1.65 to one advancing. There were 271 new highs and 11 new lows. The five day moving average of New Highs is 141 while the five day moving average of New Lows is 17 and the ten day moving average of Net Advancing is 214. The Net Advancing data indicates a bullish trend.

Advancing volume was higher at a ratio of 2.43 to one. The closing TRIN was 0.68 and the final tick was 1013. The NYSE Composite Index gained 0.51% today while the SPX gained 0.26%.

For the NYSE, relative to the previous 30 session average, volume was -11.72% below the average. Of the last 15 sessions 6 sessions ended with volume greater than the previous rolling 30 day average volume. Of the last 30 sessions, 20 sessions ended on a positive tick, 6 of last 10. For the SPX, the day's volume was 81.2% of the average daily volume for the last year. Volume was 91.8% of the last 10 day average and 73.3% of the previous day’s volume.

Strong market breadth with the advancing volume again outpacing advancing issues. The broad NYSE Composite Index again outperformed the SPX. One interesting and possibly significant thing to take notice of is the action of the ten day average Net Advancing. This fell from last night and appears to be at risk of falling below 200. While the SPX is at 52 week highs, the NYSE advance/decline line is not. This is a negative divergence which we must keep in mind and keep an eye on.

Total tick for the day was 135,000 and the average tick for the day was 87. There were 51 ticks greater than 600 and 8 ticks more extreme than -600. There were no ticks greater than 1000 and no ticks more extreme than -1000. This tick action suggests institutional accumulation.

Fridays leaders were Materials, Energy, Tech and Financials, Laggards were Industrials, Staples, Healthcare, Con. Discretionary.


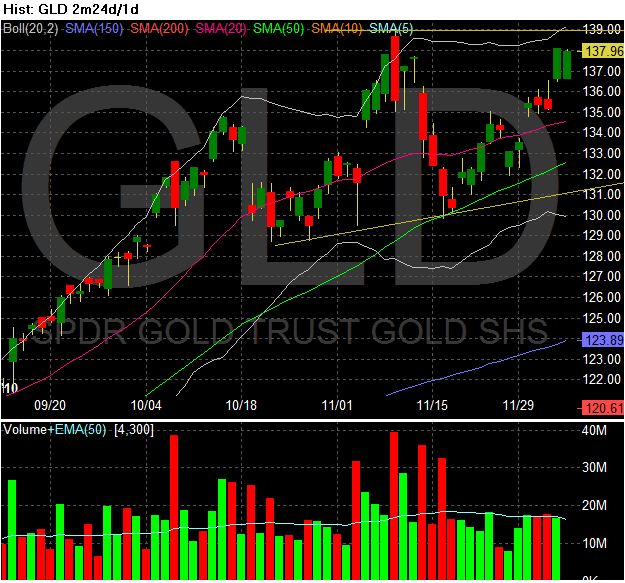
What a week for the metals and miners, the strong secular bull continues. There was a shake out attempt last Thursday when everything in this sector looked as if it was going to nose dive around 12 o'clock. Must have been a computer program set to scare the weak holders. The following day the strong holders were rewarded and now we are at the recent highs, and the charts say that we will take them (old highs) out. If gold stays above 1400 for a while the shorts will panic as they did in silver as I wrote around the 25-26 level. We had a top in that move, sold off and slowly and confidently took it out. Looking at the volume (see spike at recent high) this move doesn't smell of a squeeze at all, this is accumulation pure and simple.


Need I say more, the junior miners look ready to explode. The fundamentals are in place for numerous takeouts in this group. As the larger companies need to show growth their mines mature, and a dearth of new finds sets the juniors up nicely. Another positive catalyst are the profits they will show at these gold and silver prices. so hold on to the bull. 


And lets not forget the biggest catalyst for the bull, Big Ben, no not that big Ben in London or the Steelers Ben, our very own Fed chair Ben. QE to infinity Ben!!!