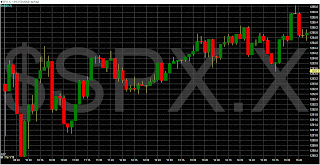
A better-than-expected bond auction in Spain, word that Russia will resume buying EU debt, and talk of an expanded Eurozone rescue fund improved the mood a fair amount. But then, Citi's weak earnings report pushed the SPX and Dow futures back into the red as the open approached. The Empire Manufacturing Index for January was reported at 11.92, which was below the consensus expectations for a reading of 12.8. The index was above the December reading of 10.57. Looking beyond the headlines, the New Orders component came in at 12.39 (vs. December 2.03) and the Employment component was reported at 8.42 vs. -3.41.
 |
| Intraday 5 min |
After the extended holiday weekend, the shortened option expiration week began without a gap. The index made a couple of slow three point up-and-down moves before 11am before settling on a gentle drift higher. But on this day of tight range trading, higher wasn't much. But once again we see buyers pounce on even the slightest of dips as this market continues to show not even the slightest of mercy to bears. The high of the day was at 3::43pm after a low of the day early in the session at 9:54am. Late day highs and early morning lows; we continue to see a bullish pattern.
Sector Performance:
Sectors stronger than the SPX for Tuesday:
- Basic Materials -- Outperformed the SPX by +41%.
- Energy -- Outperformed the SPX by +48%.
- Industrials -- Outperformed the SPX by +58%.
- Utilities -- Outperformed the SPX by +9%.
- Health Care -- Outperformed the SPX by +23%.
- Consumer Discretionary -- Outperformed the SPX by +15%.
Sectors weaker than the SPX for Tuesday:
- Financials -- Underperformed the SPX by -77%.
- Technology -- Underperformed the SPX by -6%.
- Consumer Staples -- Underperformed the SPX by -8%.
For the SPX Index there were 298 components advancing and 180 components declining. On the NYSE 3,140 issues were traded with 1,646 advancing issues and 1,393 retreating issues, a ratio of 1.18 to one advancing. There were 305 new highs and 47 new lows. The five day moving average of New Highs is 218 while the five day moving average of New Lows is 72 and the ten day moving average of Net Advancing is 115.
Declining volume was higher at a ratio of 1.31 to one. The closing TRIN was 1.55 and the final tick was -100. The five day average of TRIN is .94 and the ten day average of TRIN is 1.0. The NYSE Composite Index gained 0.2% today while the SPX gained 0.14%.
For the NYSE, relative to the previous 30 session average, volume was 28.25% above the average. Of the last 15 sessions 8 sessions ended with volume greater than the previous rolling 30 day average volume. Of the last 30 sessions, 20 sessions ended on a positive tick, 9 of last 10. For the SPX, the day's volume was 115.5% of the average daily volume for the last year. Volume was 123.6% of the last 10 day average and 114% of the previous day’s volume.
Declining volume was higher than advancing volume; the action today was in the declining stocks. New Lows remain quite high considering that the indices are making new 52 week highs. The extreme ticks continue to show institutional selling but the indices continue to creep upward.
Total tick for the day was 48,000 and the average tick for the day was 31. There were 9 ticks greater than 600 and 33 ticks more extreme than -600. There were no ticks greater than 1000 and no ticks more extreme than -1000. The tick action suggests institutional distribution.
With such a lack of range and lack of volatility it is impossible to make much of any volume pattern. Looking at our Nightly Breadth Indicators also doesn't reveal much as the indicators really didn't move much from Friday. But it is curious to note that many of the indicators were down on an up day today. Of particular interest is the Cumulative Volume Index moving down today. But we all know that right now nothing matters as every two point dip creates a buying frenzy.

No comments:
Post a Comment