 |
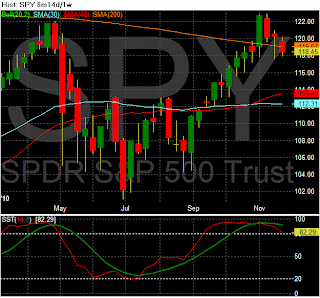
| Closed Below 200wkMa |
The North Korean attack, Ireland's/European banking woes brought a lot of fear into the markets on Tuesday. At 830am the GDP was released it showed the economy grew at an annualized rate of 2.5% in the quarter. This was above the consensus expectations for a growth rate of 2.4%. The consumer activity, the Personal Consumption component of the report came above expectations with a gain of 2.8% vs. 2.5%. And on the inflation front, the Deflator came in at 2.2% vs. 2.3%. We had a heavy plunge downwards at the open this was followed by two weak attempts to push the market higher but they failed. The buying of the dips isn't working like it was last couple of months.
Gold was strong as you might expect but small caps and semiconductors were relatively strong as well.For the SPX Index there were 34 Advancers/455 Decliners. On the NYSE 3,130 issues were traded with 681 advancing issues and 2,379 retreating issues, a ratio of 3.49 to one declining. There were 37 new highs and 31 new lows. The five day moving average of New Highs is 72 while the five day moving average of New Lows is 21 and the ten day moving average of Net Advancing is -322. The Net Advancing data indicates a bearish trend.
Declining volume was higher at a ratio of 11.04 to one. The closing TRIN was 3.16 and the final tick was -390. The NYSE Composite Index lost -1.83% today while the SPX lost -1.45%.
For the NYSE, relative to the previous 30 session average, volume was -4.94% below the average. Of the last 15 sessions 8 sessions ended with volume greater than the previous rolling 30 day average volume. Of the last 30 sessions, 20 sessions ended on a positive tick, 5 of last 10. For the SPX, the day's volume was 83.4% of the average daily volume for the last year. Volume was 94.2% of the last 10 day average and 103.9% of the previous day’s volume.
Breadth was strongly negative today and the strength in declining volume was severely negative for the markets. The broad NYSE Composite Index fared significantly worse than the SPX suggesting that we have even more work to the downside yet to come.
Todays tick pattern resembles a bottoming may be occurring but this isn't as convincing as I'd like. The intraday volume pattern clearly spiked with every downward move; this often leads to even more selling. The breadth indicators are quite bearish again. The McClellan Summation Index has moved half way towards zero since its peak on November 9th. Any move below zero on this indicator would signal a significant pullback in progress similar to the end of August.
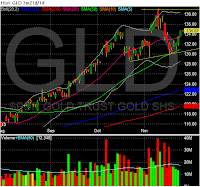
As you can see precious metals still look good, Silver was down today while Gold was up. The trend has been the reverse since early October. Silver has significantly outperformed Gold YTD and since 10-6-18 Gold was up 2% while silver was up 18%. Something to keep an eye on.
 |
| Looking for an entry point, was hoping to get one during this sell-off but no such luck as yet! |
 |
| Looking for entry above 30wkMa |
 |
| Watch support levels, this is up big in a short period of time so as the market sells off people will take profits aggressively. |


No comments:
Post a Comment