This has been a very profitable investment (only on a percentage basis) to this point. But I could wake up one morning and find a situation like Lehman. But then again I think the market cap in these is so small (don't need a lot of money to save them) and they have exposure to whole of Europe. I don't think anyone is gonna let these go under (but thats what I thought when two days before Lehman went down I bought a few thousand shares OUCH! In the words of Roger Daltrey (The Who), "WE WONT GET FOOLED AGAIN"
So here is my play book
"Economic or market trend associated with some characteristic or phenomenon which is not cyclical or seasonal but exists over a relatively long period".
Monday, December 13, 2010
SLV follow up 60min Daily Chart
Beautiful move off the 27.34 sell off multiple retest of that level, nice gap up watch for support around 28.30 for any new buys. New target 32.5, time frame 7trading sessions (needs to clear 29 first). I will re-evaluate. Long-term add on significant dips and they are sure to come in this metal.
Gold and Silver Update
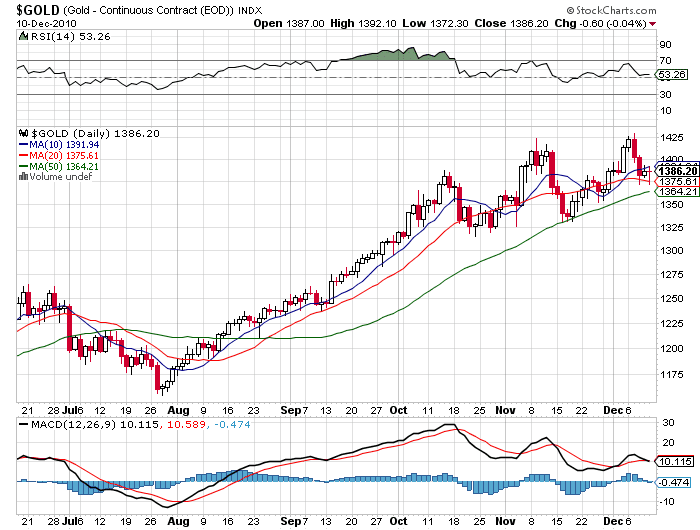
There was technical damage done to the gold chart last week with the price trading below the 10dma, short term thats negative. Gold has support at the 20dma but the average has turned from up to down. If you are a short-term trader then you must watch this 20dma level. To scare of the bears, gold need to stay above 1400 but a break below 1380 will cause further selling probably down to next support at 50dma. All this being said from what I am reading there is tremendous demand in the physical market for both gold and silver and there are rumors that JPM or someone that big is the major seller at the behest of the Fed. The big Asian buyers are the ones that see the game the FED is playing and are buying the dips . The print and spend Jig will be up soon enough!
The Silver chart looks similar to the gold chart but is stronger on a technical basis. While gold is testing its 20dma Silver is firmly above it and though there is a slight turn down of the 20dma in silver not as pronounced as gold. Further more the sell off in Silver this time wasn't like the one in November. In November volume spiked 5x normal and this time around it wasn't even close to double. So in my opinion this was clearly profit taking. The long-term trend is in tact and I did some buying on the pull backs. Remember to sell small amounts as we go up and buy the dips.
Calling a top
I believe the the markets are being manipulated, we can all agree that the trend has been to wake up see the futures higher every day. Then at the open there is higher relative volume and stocks sell off and later in the day buyers come in or is that all the sellers are gone for the day and the market rises.
This is a nice theory but I will present some evidence in support.
1. TICKS: Lets talk about Ticks, no not the parasite but as it relates to the markets. For those of you who are new or just curious you can find answers in Investopedia or click the link. (http://stocks.about.com/od/evaluatingstocks/a/091309TICK.htm). On Monday and Friday, extreme ticks favored the bulls by a wide margin, 83 to 31. Monday's session moved down after the open, recovered quickly, moved down once again, and then spent most of the session recouping loses. Friday's session had the expected early move lower then spent the rest of the day crept higher. These numbers are actually quite unconvincing for a two-session total but bulls in control 2:1 ratio.
Now let's examine the Tuesday, Wednesday, Thursday sessions. On these days the extreme ticks were 81 for the bulls and 241 for the bears, a three-to-one ratio certainly more convincing numbers when compared to Monday and Friday. Yet each of these days closed in the plus column. All three sessions had the early morning dip after gaps higher as sellers took advantage of the gaps. Then the dip buyers bid the tape back up higher later in the day.
For the week, extreme ticks were 164 for the bulls and 272 for the bears and the ticks greater than 1000 were none for the bulls and six for the bears. This is clearly evidence of institutional computers selling hard, not buying.
Caution: I'm willing to bet it's the same computers that are bidding the futures higher overnight. And we're suggesting that when they are through distributing, they'll quit the overnight bidding... and then the dip buyers run the risk of being left holding the bag.
2. SENTIMENT: No not a nostalgic romantic feeling but the feeling that is felt by many people in this case bulls or bears. Friday’s ISEE Sentiment Index closed at 230, which is the highest reading since January 30, 2006. The ISEE Equity Only closed at 343, the highest since April 15th. The ten day average of the ISEE Equity Only is at 245, just below the 249 high of April 15th.
3. TRIN: No not Trinidad, as the locals call it but the advancing issues divided by the declining issues, divided by the volume of advancing issues, divided by the volume of declining issues. The ten day moving average of NYSE TRIN closed at .604 today, which is the most overbought reading in more than twenty years. The ten day average of the Put/Call ratio is at .74. When you combine all these we are at historic levels of overbought, levels seen rarely in history.
So to my friends on twitter be very cautious is you are long I believe that we are within ten points of a significant top. I base this judgment on the above data as well as other breadth data . Tops are notorious for lingering; they do not form the same way as bottoms form.
![]() |
| Dollar trying desperately to hold wk-ma |
In spite of another hike in China's reserve requirement, things were stable in the pre-market with futures pointing modestly higher once again. The government reported that Import Prices for the month of November rose by +1.3%, which was higher than the consensus for an increase of +0.8%. Export prices rose by +1.5%, above expectations for +0.6%, and above last month’s unrevised +0.8%. The U.S. Trade Deficit fell in October to $38.7 billion, which was below the consensus estimate for a deficit of $42.9 billion.
The final session of the week began with a small one point gap higher but within moments was three points higher. The SPX traded sideways for most of the opening thirty minutes before making a quick fifteen minute four point plunge that appeared to many traders as setting the tone for the day. But sentiment quickly reversed and the index spent the rest of the session working slowly higher with nothing as large as a two point decline the rest of the session as bulls once again owned the tape and allowed bears nothing at all.
The SPX gained 15.69 points during the week. The four week RSI of the four indices (SPX, Dow, NASDAQ, and Russell 200) is 82. Pullbacks often occur as this RSI reaches 80 and bounces near 20.
For the SPX, there were 291 components advancing and 158 declining. Total tick for the week was 34,000. The number of components with their 5 DMA above their 20 DMA increased during the week from a ratio of 3.86 to one to 8.02 to one.
On the NYSE, the advance/decline line increased slightly during the week by 529 and the 10 DMA of Net Advancing increased from 214 to 279.
Volume for the week was the highest since the week of June 28th.
For the SPX Index there were 339 Advancers/106 Decliners. On the NYSE 3,154 issues were traded with 1,969 advancing issues and 1,096 retreating issues, a ratio of 1.8 to one advancing. There were 203 new highs and 49 new lows. The five day moving average of New Highs is 212 while the five day moving average of New Lows is 26 and the ten day moving average of Net Advancing is 279. The Net Advancing data indicates a bullish trend.
Advancing volume was higher at a ratio of 3.27 to one. The closing TRIN was 0.55 and the final tick was 758. The five day average of TRIN is .61 and the ten day average of TRIN is .61. The NYSE Composite Index gained 0.53% today while the SPX gained 0.6%.
For the NYSE, relative to the previous 30 session average, volume was -9.25% below the average. Of the last 15 sessions 6 sessions ended with volume greater than the previous rolling 30 day average volume. Of the last 30 sessions, 20 sessions ended on a positive tick, 8 of last 10. For the SPX, the day's volume was 98.7% of the average daily volume for the last year. Volume was 105.5% of the last 10 day average and 102.1% of the previous day’s volume.
The oddity in the above data is the New Lows for Friday; double the New Lows from Thursday. Notice the TRIN data.
Total tick for the day was 154,000 and the average tick for the day was 99. There were 56 ticks greater than 600 and 19 ticks more extreme than -600. There were no ticks greater than 1000 and no ticks more extreme than -1000.
No Change to my positions except that I added to GLD and SLV on the strength of the dollar and big pull back.
Have a great week everyone
Subscribe to:
Posts (Atom)